| Original research | Peer reviewed |
SummaryObjectives: To develop and validate a pig weight-estimation method using body length and girth measurements. Methods: In a random sample of 288 smallholder pig farms in Western Kenya, pigs were weighed (kg) and their lengths and girths were measured (cm). Prediction models were generated using 75% of the data and validated using the remaining 25%. Weight was regressed on length and girth using mixed model analysis after controlling for village as a random effect. Models were developed for pigs categorized as young (≤ 5 months), market age (5.1 months to 9.9 months), and breeding age (≥ 10 months). Results: Weights (mean ± SD) of the young, market-age, and breeding-age pigs were 12 ± 6.1 kg, 30 ± 11.4 kg, and 42 ± 17.0 kg, respectively. Models for the young, market-age, and breeding-age pigs were weight = 0.18 (length) + 0.36 (girth) – 16, weight = 0.39 (length) + 0.64 (girth) – 48, and weight = 0.36 (length) + 1.02 (girth) – 74, respectively. A single prediction model for weight = 0.25 (length) + 0.56 (girth) – 32 was also developed. Weight predicted by the models was a more accurate estimate than that provided by the farmers (P < .05). Length and girth explained 88% to 91% of the total variation in weight. Implications: The weight-estimation tool will empower Kenyan farmers to have better bargaining powers when they sell their pigs and will act as an incentive to better manage their pigs through improved feeding and husbandry.
| ResumenObjetivos: Desarrollar y validar un método de estimación de peso para cerdos utilizando medidas corporales de longitud y circunferencia. Métodos: En una muestra al azar de 288 granjas pequeñas en el Oeste de Kenia, los cerdos fueron pesados (kg) y se midieron sus longitudes y circunferencias (cm). Los modelos de predicción se generaron utilizando 75% de la información y se validaron utilizando el 25% restante. Se hizo una regresión del peso en longitud y circunferencia utilizando análisis de modelo mixtos después de controlar la villa como un efecto al azar. Se desarrollaron modelos para cerdos catalogados como jóvenes (≤ 5 meses), edad de venta (5.1 meses al 9.9 meses), y edad de reproducción (≥ 10 meses). Resultados: Los pesos (promedio ± SD) de los cerdos jóvenes, los cerdos en edad de venta, y los cerdos en edad de reproducción fueron de 12 ± 6.1 kg, 30 ± 11.4 kg, y 42 ± 17.0 kg, respectivamente. Los modelos para los cerdos jóvenes, en edad de venta, y en reproducción fueron peso = 0.18 (longitud) + 0.36 (circunferencia) – 16, peso = 0.39 (longitud) + 0.64 (circunferencia) – 48, y peso = 0.36 (longitud) + 1.02 (circunferencia) – 74, respectivamente. Un modelo de predicción para peso = 0.25 (longitud) + 0.56 (circunferencia) – 32 fue desarrollado. El peso predicho por los modelos fue una estimación más precisa que el provisto por los granjeros (P < .05). La longitud y la circunferencia explicaron del 88% al 91% de la variación total en el peso. Implicaciones: La herramienta de estimación de peso ofrecerá a los productores de Kenia mejores oportunidades de negociación al momento de la venta de sus cerdos y actuará como un incentivo para optimizar el manejo de los animales mediante un programa mejorado de manejo y alimentación.
| ResuméObjectifs: Développer et valider une méthode d’estimation du poids des porcs en utilisant les mesures de la longueur du corps et de la circonférence thoracique. Méthodes: À partir d’un échantillonnage aléatoire de 288 fermes porcines de petites tailles au Kenya occidental, des porcs ont été pesés (kg) et leur longueur et circonférence thoracique mesurés (cm). Des modèles prédictifs ont été générés en utilisant 75% des données et validés en utilisant les 25% qui restent. Une régression du poids en fonction de la longueur et de la circonférence thoracique a été faite à l’aide d’un modèle mixte d’analyse en contrôlant pour le village comme effet aléatoire. Des modèles ont été développés pour les porcs catégorisés comme jeune (≤ 5 mois), âge de marché (5.1 mois à 9.9 mois), et en âge de se reproduire (≥ 10 mois). Résultats: Le poids (moyenne ± écart-type) des porcs des groupes jeune, âge de marché, et âge de se reproduire étaient respectivement de 12 ± 6.1 kg, 30 ± 11.4 kg, et 42 ± 17.0 kg. Les modèles pourles porcs des groupes jeune, âge de marché, et âge de se reproduire étaient respectivement poids = 0.18 (longueur) + 0.36 (circonférence thoracique) – 16, poids = 0.39 (longueur) + 0.64 (circonférence thoracique) – 48, et poids = 0.36 (longueur) + 1.02 (circonférence thoracique) – 74. Un modèle prédictif unique a également été développé où le poids = 0.25 (longueur) + 0.56 (circonférence thoracique) – 32. Le poids prédit par les modèles étaient un estimé plus précis que celui fourni par les éleveurs (P < .05). La longueur et la circonférence thoracique expliquaient 88% à 91% de la variation totale du poids. Implications: L’outil d’estimation du poids permettra aux éleveurs kenyans d’avoir un meilleur pouvoir de négociation lorsqu’ils vendront leurs porcs et agira comme un incitatif à avoir une meilleure gestion de leurs porcs en améliorant leur alimentation et leur conduite d’élevage.
|
Keywords: swine, weight-prediction tool, smallholder pig farmer, length and girth, market
Search the AASV web site
for pages with similar keywords.
Received: November 11, 2009
Accepted: March 3, 2010
Weight predictions using body measurements have been used in various species of animals.1,2 Backyard farmers in the Philippines used length and girth measurements to estimate weights of their pigs because they could not afford weighing scales.3 A strong correlation between weight and girth measurements has been reported in calves.4 The main method of determining the weight of animals in the absence of weighing scales is to estimate the weight using a number of body characteristics that are readily measured. Typically, weight is regressed on body measurements to determine a weight-prediction equation.1,3
In rural Western Kenya, pigs serve as a major source of family income; farmers mainly keep native breeds that are usually confined by tethering, but may be allowed to roam freely.5 Farmers rely on family labor to manage the pigs, which are fed on locally available feedstuffs. Receiving sufficient money for pigs sold has been a major challenge affecting smallholder pig farming, according to these farmers. Local traders, usually pork butcher men, travel between farms on bicycles looking for pigs to buy. Rural farmers have no system in place to estimate a pig’s weight. Obviously, the most accurate method of measuring a pig’s weight is by weighing it using a scale, but pig farmers in Western Kenya cannot afford such scales. The only option left is guessing the weight of the pig prior to selling. If farmers underestimate the weight of their pigs, they may settle for a price below market value and they subsequently lose money. To the author’s knowledge, prediction of the pig’s body weight using girth and length measurements has not been studied in rural Western Kenya or in other similar settings in East Africa. In this study, we determined and validated models that farmers can use to predict live weights of pigs using body measurements.
Materials and methods
This research was approved by the Director of Veterinary Services in Kenya; the Board of Postgraduate Studies, University of Nairobi; and the Animal Care Committee and the Ethics Board of the University of Guelph.
Study locations
Two districts of Western Province, namely Busia and Kakamega, were purposively selected for the study because of the popularity of rural pig keeping in these areas. In each district, two pig-keeping sublocations were identified. A sampling frame of all small-scale pig keepers in each sublocation was established through the help of the local provincial administration. In 1999, Kakamega District had an estimated population of 603,500 and occupied approximately 17% of Western Province. In the same census, Busia District had an estimated population of 370,600 and occupied approximately 14% of Western Province. The village elders guided the researchers in locating the pig farms and played an important role in creating a strong working relationship between the researchers and the pig farmers.
Selection of study farms
In total, 288 farms were included in the study. Farms within each village were randomly selected, proportional to the total number of farms, to include between 65% and 75% of all farms in each village. For each village, each farm was given a number and the numbers were put in a bag. The numbers were then randomly selected from the bag until sufficient farms had been selected. No pig farmer refused to participate during the initial farm visits.
Weighing and measuring pigs
Most of the pigs on the farms visited were weighed, and body measurements were taken at each visit. Only nursing pigs that the farmer wished to sell and pregnant sows were exempt from being weighed or measured. The records of the 42 pigs removed during data cleaning were missing either a weight or an age measurement for unknown reasons. Other measurements excluded from analyses were those from pregnant sows (n = 130), pigs too heavy for the scale (n = 16), and pigs too difficult to restrain (n = 14).
The farmer was asked to estimate the age and the weight of each pig, which was then restrained by a member of the research team. Small pigs were held in the restrainers’ arms, while pigs too large to hold were restrained using a hog snare. To ensure accuracy, each pig was restrained in a straight posture before any measurement was taken.
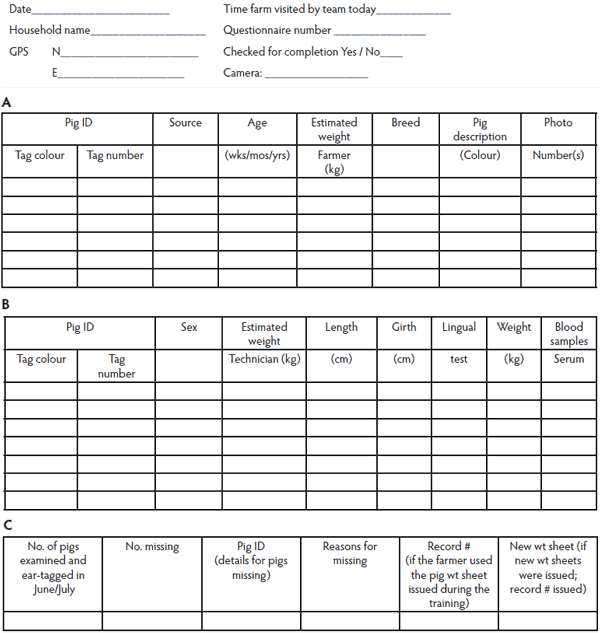
A uniquely numbered ear tag was inserted in each pig’s ear. A measuring tape was then used to determine the body length in centimeters from the midpoint between the ears to the point where the tail joined the body (Figure 1). The girth was measured in centimeters around the pig’s body, just behind the forelegs. For pigs weighing < 10 kg, a small spring scale that measured to a maximum of 15 kg was used to weigh the pig. Larger pigs were weighed with a circular spring scale that weighed to a maximum of 100 kg. Each scale was set to zero before a pig was weighed. Both scales were accurate to 0.1 kg. Small pigs were placed in a basketball net with one end tied together; the net was then suspended from the scale. Larger pigs were suspended with two horse girths that were fitted just in front of the hind legs and behind the forelegs (Figure 2). The scale was suspended from a tree branch and the horse girth was attached to the bottom of the scale using a hook (Figure 3). During the follow-up visits, all pigs that were still on the farm were weighed and their length and girth measurements were taken. New pigs were ear-tagged, measured, weighed, and included in the study. Data were recorded on previously prepared weight-recording sheets (Figure 4).
Figure 1: Using a tape measure to determine body length in centimetres as the distance from the midpoint between the ears to the point where the tail joins the body, for pigs on smallholder farms in Western Kenya.
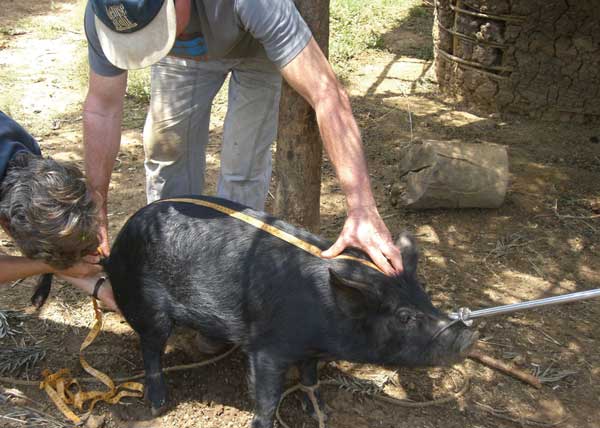 |
Figure 2: Using two horse girths to support a pig for weight determination in a study in Busia and Kakamega Districts, Western Kenya.
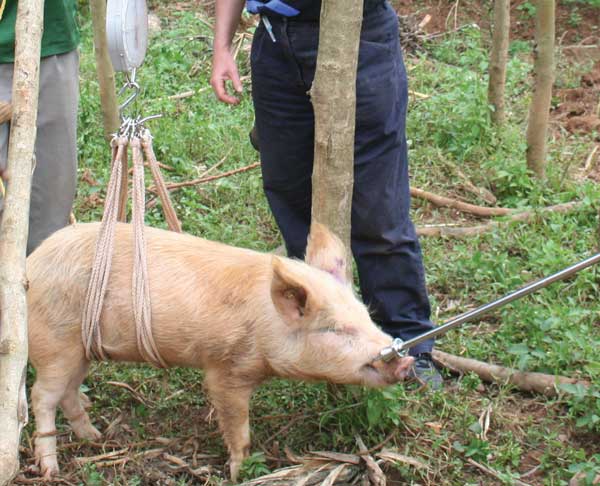 |
Figure 3: Scale used in weighing pigs in Busia and Kakamega Districts, Western Kenya.
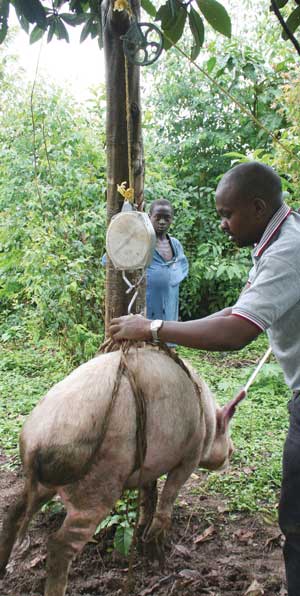 |
Figure 4: Sample data sheet used in pig weight data-collection exercise in smallholder farms of Busia and Kakamega Districts, Western Kenya. The lingual test was an examination of the pig’s tongue for Taenia solium (tapeworm) cysts.5
 |
Pig age categories
The pigs were put into three age categories, representing young pigs before the typical market weight was achieved (≤ 5 months old), those in the typical marketing age but younger than the typical breeding age (5.1 months to 9.9 months), and those of breeding age (≥ 10 months). In cases where the pig farmer could not estimate the age of the pig, length and girth measurements were used to place the pig in its appropriate age category.
Data entry and analysis
Data were entered into MS Access (Microsoft Corporation, Microsoft Way, Redmond, Washington) and exported to Stata software (Stata Corporation, College Station, Texas) for statistical analysis. When farmers were asked to estimate the age of their pigs, some estimated the number of months they had owned the pig rather than the actual age of the pig. Age was therefore underestimated by approximately 1.5 months, an assumption made because weaned pigs in the study area were typically purchased between 4 and 8 weeks of age. Data were divided into two unique data sets. The first data set (model dataset) was composed of a random sample of 75% of all pigs that were measured once and one randomly selected observation from each pig that was measured more than once. To select these, all pigs that were measured more than once were sorted by pig identification and date when the measurements were taken; each pig measured more than once was thus ordered by the smallest to the largest weight. For pigs measured twice, the first observation of the first pig and the second observation of the second pig were included in the first data set. This systematic process was repeated until all pigs were represented once in the data set. Pigs weighed three times were also ordered by their smallest, middle, and largest weights. The observations were selected in a systematic manner to include the largest, smallest, and middle weights of the first three pigs and so forth until all pigs were represented once in the dataset. This dataset was used to develop the mathematical weight equation.
The second data set (validation dataset) was composed of the remaining 25% of the observations for pigs weighed once and the remaining observation for pigs weighed twice.6 One other observation was included for pigs measured three times. The smallest, middle, and largest weights were selected for the first three pigs, and this pattern was repeated. Each pig was represented only once in this dataset, which was used to validate the weight model developed using the first dataset. The third or remaining observation for the pigs weighed three times was used neither in the model nor in the validation datasets and was not used for this study.
Mixed linear model analyses with a random effect of village (Stata command by sort age category: xtreg weight girth length, re i[village]) were performed by regressing weight on length and girth and gender of the pig for each age category. An additional single model was developed to assess the overall effect of age, length, and girth on the pig’s weight. Fixed effects were retained in the model if they were significantly associated with weight at P < .05. The residuals for the final models for each dataset were examined to determine whether the assumptions of linear regression were met. The predicted weight for each pig in the three validation datasets was determined using the coefficients developed in the model datasets. These were compared to the actual weight measured on each pig, and the differences were used for descriptive statistics. The actual weight was compared to the predicted weight using a paired t test. Finally, the difference between the actual weight and the farmer’s estimate of the pig’s weight was calculated. The distribution of this calculated difference was compared to the distribution of the difference between the actual pig weight and predicted values from the models. The absolute values of the within-pig differences were compared using a paired t test at a 95% level of confidence.
Results
Pig statistics
From a total of 628 pigs, 1042 pig observations were made, but complete length, girth, and weight measurements were available for only 840 pig observations. The numbers of pigs examined over time in Busia varied by the farm visit number: 281 observations were made in the initial visit, 226 in the second visit, and 157 in the third visit. During the second visit to Busia district, three farmers chose not to participate in the study, and three other farmers were not interviewed because they no longer had pigs and also were not available to be interviewed. In the third visit, the number of farmers decreased by 29 because they didn’t own pigs during the second visit and they still had not acquired pigs by the time the third visit was made.
A total of 88 farmers acquired new pigs in the course of this study; 78 new pigs were recorded during the second visit and 45 during the third visit. Most of these farmers (57 of 88; 64%) had acquired one pig, and two of 88 (2%) had acquired four pigs. Of the 151 pigs that were lost to follow-up, 115 (76%) had been sold and 20 (13%) had died, while the remaining six (3%) had been stolen.
Age and pig weight
Among the 840 pig observations, 363 pigs (43%) were aged ≤ 5 months, 305 (36%) were aged 5.1 months to 9.9 months, and 172 (21%) were aged ≥ 10 months. In the course of the study period, 449 pigs were weighed once, 146 were weighed twice, and 33 were weighed three times. Pig weight increased with increasing age (Figure 5). On average, these pigs weighed 12 kg (SD = 6.1), 30 kg (SD = 11.4), and 42 kg (SD = 17.0) by age category, respectively. Only 27 pig observations had missing age information because farmers owning them could not estimate the age of these pigs. Fifty-one percent of the observations were on female pigs. The weight of young female pigs up to 5 months of age was 13 kg (SD = 6.4), with males in the same age category weighing 12 kg (SD = 5.8); females aged 5.1months to 9.9 months weighed 30 kg (SD = 12.2), with males in the same age category weighing 29 kg (SD = 10.6). The weight of adult female pigs was 44 kg (SD = 17.9), whereas adult males weighed 35 kg (SD = 12.6). The distribution of body weight in the whole dataset was skewed to the right because there were fewer pigs in the oldest age category.
Pig weight and body measurements
Descriptive statistics for the body measurements in the three age categories are summarized in Table 1. The relationship between pig weight and girth measurements for the different age categories is illustrated in Figure 6. The 75th percentile of each measurement for the younger pigs overlapped with that of the next older age category. The 75th percentile for length, girth, and weight for the market-age pigs overlapped with the 25th percentile of measurements for the breeding-age pigs (Table 1).
Table 1: Distribution of length, girth, and weight measurements across three age categories for pigs measured* and weighed† in smallholder farms in Busia and Kakamega Districts, Western Kenya
* Body length measured from the midpoint between the ears to the point where the tail joins the body; girth measured just behind the forelegs. † Pigs were weighed on spring scales: for pigs up to 10 kg, a small scale, maximum weight 10 kg; and for pigs over 10 kg, a larger spring scale, maximum weight 100 kg. Both scales accurate to 0.1 kg. |
||||||||||||||||||||||||||||||||||||||||||||||||||||||||||||||||
Regression equations
The model datasets included a total of 509 pig observations: 229 for pigs ≤ 5 months old, 183 for pigs 5.1 months to 9.9 months old, and 97 for pigs ≥ 10 months old. The mean weights for pigs in the three age categories in this dataset were 11 kg (SD = 5.6; 95% CI, 10.6-12.1), 30 kg (SD = 10.9; 95% CI, 28.2-31.3), and 44 kg (SD = 18.6; 95% CI, 40.6-48.1) for pigs ≤ 5 months old, 5.1 months to 9.9 months old, and ≥ 10 months old, respectively.
Length and girth explained 88% to 91% of the total variation in weight for the three pig-age categories. Including village in the model accounted for 15%, 2%, and 26% of the random variation for young, market-age, and breeding-age pigs, respectively. Sex of the pig was not associated with weight in any of the age categories (P > .05). Model diagnostics using the residuals confirmed the assumptions of the models. For the young pigs, ≤ 5 months old, the regression model results indicated that weight increased by 0.18 kg and 0.36 kg as length and girth increased by 1 cm, respectively. For pigs 5.1 months to 9.9 months old, weight increased by 0.39 kg and 0.64 kg as length and girth increased by 1 cm, respectively. Finally, for breeding pigs, aged ≥ 10 months old, weight increased by 0.36 kg and 1.02 kg as length and girth increased by 1 cm, respectively.
Model validation
The second dataset, which comprised 298 observations, was used to validate the model developed above. This included 123 pigs aged ≤ 5 months, 109 pigs aged 5.1 months to 9.9 months, and 66 pigs aged ≥ 10 months. The mean weights for pigs in the three age categories in the dataset were 14 kg (SD = 6.7; 95% CI, 12.4-14.8), 30 kg
(SD = 11.9; 95% CI, 26.7-31.2), and 39 kg (SD = 14.4; 95% CI, 35.7-42.7) for pigs ≤ 5 months old, 5.1 months to 9.9 months old, and ≥ 10 months old, respectively. Examination of the residuals confirmed that the assumptions for the linear regression model were met. Predicted weight increased with increasing length and girth measurements. Descriptive statistics for the difference between actual body weight and predicted weight are summarized in Table 2. Similarly, descriptive statistics for the farmer’s estimate of the pig weight minus the actual weight are presented in Table 2. The weight predicted by the models was a closer approximation of the pig’s actual weight than the farmer’s estimate.
Table 2: Differences between actual pig weight and body weight predicted either by a regression model or by the farmer’s estimate of the pig’s weight for 298 observations in pigs from smallholder farms in Western Kenya, 2006-2007*
* Measurements and pigs described in Table 1. Observed pig weights (SD): 123 pigs ≤ 5 months of age, 14 (7) kg; 109 pigs 5.1 months to 9.9 months of age, 29 (11) kg; and 66 pigs ≥ 10 months of age, 39 (14) kg. |
|||||||||||||||||||||||||||||||||||||||||||||||||||||||||||||||
The predicting models underestimated the actual weight of the pigs < 10 months old by 0.08 to 1.1 kg, and overestimated the weight of pigs ≥ 10 months by 0.04 kg. Farmers underestimated the weight of pigs on average by 3.2 kg (SD = 7.9), 2.9 kg (SD = 24.8), and 8.0 kg (SD = 23.4) for young, market-age, and breeding-age pig categories, respectively (Table 2). The farmer’s estimate of the weight was lower (P < .05) than the actual weight of the pig for the three pig-age categories. There was no difference (P > .05) between observed weight and the weight predicted by the model. The overall absolute difference between the farmer’s estimate and the actual weight (4.18 kg) was larger than the overall difference between the actual pig’s weight and the weight predicted by the model (0.41 kg). This difference (3.77; CI, 1.57-5.96) was statistically significant (P < .05). The single model overestimated the weight of the pig by 0.73 kg (SD = 4.2).
Development of the pig-weight estimation tool
The three weight-prediction equations were presented to farmers during village farmer-training workshops. Observations by the researchers indicated that pig farmers had a difficult time utilizing the equations (data not shown). Because of this difficulty, three weight-estimation tools corresponding to the three pig-age categories were developed. The three age-specific charts and a single chart representing the overall effects of age, length, and girth measurements on pig weight are available at www.aasv.org. Length (distance from the middle of the head between the ears to the point where the tail attaches the body) is presented on the x-axis of each chart, while girth, measured behind the foreleg of the pig, is presented on the y-axis. As an example, and based on the chart representing all age categories, a pig with a girth measuring 80 cm and a length measuring 100 cm will weigh approximately 38 ± 4.2 kg. Demonstrations on how the charts could be used to estimate the live weight of the pigs were performed during the second farmer training sessions.
Discussion
Farmers had to own a pig during the first visit to be included in the study; however, some no longer owned a pig during the follow-up visits. Pig farming in Western Kenya is very dynamic, with pig numbers fluctuating over time and by season. Most of the pigs lost to follow-up had been sold, an indicator of the potential role these animals play in the livelihood of the local people. Pigs were sold when they were > 5 but < 10 months old. Hence, there was a skewed distribution observed in biological measurements, reflecting fewer adult pigs in the population. Some farmers reportedly asked their friends or family to house their pigs because of a seasonal lack of food available. This strategy corresponds to contract farming used in commercial swine production, where one person owns a pig but hires another person to feed and care for it. These pigs were still included in the study because farmers brought them back to the original farm for the follow-up examinations.
Previous studies have shown that the live body weight of an animal can be estimated using linear body measurements.1,3,6 Wither height, chest girth, and length were used to determine body weights of goats in India.2 Abdelhedi and Balbiker7 reported a high correlation between heart girth and live weight in a study involving zebu cattle in Sudan. In the current study, length and girth were used to determine the weight of pigs in rural Western Kenya. Pig weight increased with increasing length and girth. The increase in body length is due to skeletal growth, while increases in girth are due to muscle development plus accumulation of adipose tissue. Linear measurements such as length and height are related to bone growth and are closely related to body weight of growing animals.3,8 Because parameters reflecting the associations changed by pig-age category, it was appropriate to use separate models for growing, market-age, and breeding-age animals. A single model was developed in addition to the age-specific models; such a model was thought to be easy for the farmers to use.
Groesbeck et al4 used girth measurements to predict pig weight in the United States. Commercial weight bands are special tape measures used to estimate the weight of pigs in North America.3,8 These weight bands are not expected to accurately estimate the weight of Kenyan pigs because they were developed for use with fast-growing European and North American breeds that are fed a commercially prepared complete feed ad libitum and typically reach 110 kg body weight at 6 months of age. The pigs in the current study were local African pigs, typically fed a limited diet of household waste, weeds, and seasonal fruits. Thus, the farmer’s only option was to guess the weight of the pig just by looking at it. These estimates are usually unreliable,8 as was found in the current study. Pig farmers underestimated the weight of their pigs, and therefore likely sold them for less than their true value. These farmers may not have achieved the true economic potential for their pig enterprise.
Both age-specific and sex-specific weight-prediction equations have already been developed. Weight-estimation models developed in the Philippines were for pigs ≤ 5 months of age.3 These models could not be adopted for use on local pigs in Western Kenya because the pigs and pig management practices were dissimilar. The Philippino pigs were not local breeds, but were three-way crosses from purebred Large White, Landrace, and Duroc breeds, kept in total confinement, and fed ad libitum, and they attained a weight of 49 kg at 5 months of age. The pigs in our study were African breeds, kept outdoors, and fed a limited diet, and reached an average weight of 20 kg at 5 months of age. In our study, gender was not significantly associated with weight of pigs; according to studies by Essien and Adesope,8 sex was an important determinant of body measurements in calves, and therefore likely influenced body weight. Applying the Philippine model to predict weight in the current study revealed a mean difference (observed weight minus the predicted weight) of 34 ± 18 kg. Thus, previous age-specific models developed elsewhere may not predict the weight of pigs in Africa because of the obvious differences in breed and feeding and housing methods.
Mixed model linear regression was used to determine the association between weight, length, and girth after controlling for the random effect of village. Using village as a random variable in the mixed model showed that village explained 2% to 26% of the
random variation in weight after accounting for the fixed effects of length and girth. Including both length and girth in the model explained a large proportion (88% to 91%) of the variation in body weight. This finding agrees with that of Murillo and Valdez,3 who determined length and girth as the best body measurements for predicting body weight.
The prediction equations are age-specific; for pigs in the market-age category (5.1 to 9.9 months of age), the model will predict the weight within 1.3 kg for half of the pigs and within 4.6 kg for 90% of the pigs. This was an improvement over the farmer’s estimate of the weight of their pigs, which was within 7 kg for half of the pigs and within 13 kg for 90% of the pigs. The equations may therefore increase the opportunity to improve the farmers’ bargaining power when they market their pigs. Farmers were taught how to use these refined age-specific weight equations to predict live-pig weight, which is expected to assist these farmers in determining the appropriate market price. Conducting market surveys to evaluate whether those calculating the weight of their pigs during sale receive better prices will be important in monitoring the impact of the study at the farmer level. It will also be important to monitor the effect on the pig buyer if farmers use the weight estimations to negotiate the price of pigs.
Problems may occur when measuring pigs: pigs move around and have a tendency to lift their heads.4 This may cause variations in both the length and girth measurements, and subsequently affects the accuracy of the predicted weights. It would be advisable for farmers to take at least two measurements and calculate average values for the length and girth for every animal examined. As suggested by Groesbeck at al,4 pigs should be confined for measurement, and where possible, muddy areas should be avoided to facilitate the measurements.
In conclusion, therefore, estimating a pig’s weight by “just looking at the pig” is questionable and produces unreliable and biased weight estimates. Estimating live weight of pigs using body measurements is a suitable alternative to weighing on scales. A separate economic analysis is currently being performed to evaluate the potential effects this tool has on pig farmer-pig trader bargaining and the effects on pricing. An understanding of this is important in the sustainability of the pig business in Western Kenya. It is important to note that the purpose this study was not to develop a weight-estimation model to be used by all pig farmers in Kenya, owing to differences in breed and management. The interest was in rural smallholder farmers keeping one or two pigs, mainly of local nondescript breeds. The tool can, however, be applied in Africa where pigs are raised under similar settings to those in the study area.
Implications
• The weight-estimation tool will empower Kenyan farmers to have better bargaining powers when they sell their pigs.
• The tool will act as an incentive for Kenyan farmers to better manage their pigs through improved feeding and husbandry.
Acknowledgements
This study was conducted by the Department of Population Medicine, University of Guelph, in partnership with the International Livestock Research Institute and the University of Nairobi. We would like to thank Veterinarians Without Borders (Canada) for their financial support of this study. We are grateful to the smallholder pig farmers who willingly participated in the study, as well as the facilitation from the government offices and the provincial administration.
References
1. Enevoldsen C, Kristensen T. Estimation of body weight from body size measurements and body condition scores in dairy cows. J Dairy Sci. 1997;80:1988–1995.
2. Thiruvenkadan AK. Determination of best-fitted regression model for estimation of body weight in Kanni Adu kids under farmer’s management systems. Livest Res Rural Dev. 2005;17: Article #85. Available at: http://www.lrrd.org/lrrd17/7/thir17085.htm. Accessed 6 October 2010.
3. Murillo MCKM, Valdez CA. Body weight estimation in triple cross pigs (large white-landrace-duroc) using external body measurements. Philippine J Vet Med. 2004;41:32–39.
*4. Groesbeck CN, Goodband RD, DeRouchey JM, Tokach MD, Dritz SS, Nelssen JL, Lawrence KR, Young MG . Using heart girth to estimate weight in finishing pigs. Kansas State University. Available at: http://www.thepigsite.com/articles/1106/use-heart-girth-to-estimate-the-weight-of-finishing-pigs. Accessed 13 October 2010.
5. Mutua FK, Randolph TF, Arimi SM, Kitala PM, Githigia SM, Willingham AL, Njeruh FM. The occurrence of porcine cysticercosis in Teso District, Western Kenya. J Swine Health Prod. 2007;15:206–212.
6. Dohoo I, Wayne M, Henrick S. Veterinary Epidemiologic Research. Charlottetown, Prince Edward Island, Canada: Atlantic Veterinary College; 2003:229.
7. Abdelhedi OM, Balbiker SA. Prediction of zebu cattle live weight using live animal measurements. Livest Res Rural Dev. 2009;21. Article #133. Available at: http://www.lrrd.org/lrrd21/8/abde21133.htm. Accessed 6 October 2010.
8. Essien E, Adesope OM. Linear body measurements of N`dama calves at 12 months in a South Western Zone of Nigeria. Livest Res Rural Dev. 2003:12: Article #4. Available at: http://www.lrrd.org/lrrd15/4/essi154.htm. Accessed 6 October 2010.
* Non-refereed reference.
.