WHAT'S YOUR INTERPRETATION?
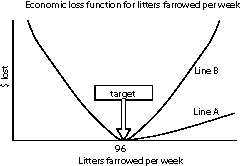 Suppose that an owner of a "typical"
herd has set a target number of 120 services to result in 96 litters
per week. If market price and cost of production are $45 and
$37 per cwt liveweight, respectively, which line (A or B) do you
think more likely reflects the economic implications of farrowing
more litters than planned, relative to the cost of farrowing less
than 96 litters?
Suppose that an owner of a "typical"
herd has set a target number of 120 services to result in 96 litters
per week. If market price and cost of production are $45 and
$37 per cwt liveweight, respectively, which line (A or B) do you
think more likely reflects the economic implications of farrowing
more litters than planned, relative to the cost of farrowing less
than 96 litters?
Consider asymmetrical losses when setting targets
The correct answer is line A. Typically, we find that the cost of being over target by one litter is substantially less than the cost of being under target by one litter. This case reminds us that when we set targets, the biological optimum is not always the economic optimum. In particular, this case illustrates an economic issue that may not be explicitly addressed when setting a target: asymmetry in the loss function.
Think about how we usually set a breeding target. In this example, I have 96 farrowing crates that I want to fill this week. I calculate the historical farrowing rate to be 80%. Therefore I might calculate 96/.8=120 pigs to breed. If I asked you, "Knowing that the farrowing rate will not be exactly 80%, which would you rather have, 95 or 97 litters?" You would likely answer "I'll take 97." Experience tells you that you could figure a way to manage around the extra litter and capture some value from it. Your intuition has told you that the estimated economic loss on either side of the current target number of farrowings is not symmetrical. This is true for virtually all of our target numbers - the economic loss function on either side of the target is not symmetrical.
The solution to this problem is to adjust the target number to achieve the true economic optimum. The classic economic example that is used to illustrate this issue is the news-vendor problem. A vendor must decide how many magazines to order each week from the printer. If too many are ordered, he is left with magazines that are worth less. If too few are ordered, the vendor loses opportunity for profit (and has disappointed customers). So the vendor must balance these two costs and order the economic optimum.
Suppose that each magazine costs the vendor $2.00 and is sold for $4.50. Any unsold magazines are returned for $.75. Therefore the cost per magazine of over-ordering is $2.00-$.75 = $1.25. The opportunity cost or lost profit for under-ordering is $4.50-$2.00 = $2.50. If he sells 150 magazines per week on average, how many should he order? The vendor recognizes that he needs to have a feel for the variability in sales per week. Suppose he has the following probabilities collected over the last year:
- 30% of the weeks he sells 100 magazines;
- 20% of the weeks,150 magazines;
- 30% of the weeks, 200 magazines;
- 15% of the weeks, 250 magazines; and
- 5% of the weeks, 300 magazines.
The vendor calculates the cost of over-ordering and under-ordering, using the different probabilities for each order quantity, and calculates that his optimum profit occurs when he orders 200 magazines. Plotting the data on a spreadsheet, we get a slightly higher number to order, since the probability distribution is continuous rather than discrete (Figure 1).

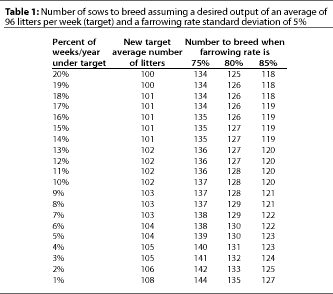
We can go through a similar process to calculate an optimum breeding target. Farrowing rate will be approximately normally distributed around a mean of 80%. That being the case, our target will be 120 breeds per week only if we think the cost per litter of over-farrowing is equal to the cost per litter of under-farrowing. Because the opportunity cost of "under" is usually more than the cost of "over," the target will be adjusted up from 120 breeds. The exact number will depend upon the farm's estimates of the costs of being under and over the target, and the predictability of farrowing rate.
A slightly different approach for arriving at the same endpoint of knowing how many sows to breed is to ask the question, "What percentage of weeks per year am I comfortable being under the targeted number of farrowings?" As this number approaches 0 (and as a herd's weekly variability in farrowing rate increases), more females will need to be bred per week (Table 1). And as more females are bred, breeding/gestation capacity, or cost of being over the target, will interfere.
The cost of being over the target can be reduced and perhaps eliminated if there is an outlet for excess pregnant sows, pigs at weaning, or pigs out of the nursery, the specific location depending on the farm's capacity. When designing new farms, one can approach this question of how many to breed in a slightly different way. In this case, the steps are as follows:
Step 1 - Calculate optimum market weight for your genetics and market, based on a matrix of incremental cost and return. Have an outlet for slow growers to increase turnover of finishing barns.
Step 2 - Calculate capacity needed in the nursery and finisher (or wean to finish) to keep pigs moving through the farm. This will depend on predicted variability in growth and availability of an outlet barn for slow growers.
Step 3 - Calculate historic average and SD for pigs weaned per week per sow.
Step 4 - Calculate number of breeds per week to have at least x pigs per week for at least y% (e.g., 99%) of weeks. Have outlets for extra gilts and bred sows.
In summary, setting targets for managing production is a common practice that can have powerful consequences. If we ask for 120 breeds and have a reward system that is directed at 120 breeds, we will likely get an average of 120 breeds, but that is not necessarily where the economic optimum is. When setting targets, consider the cost implications of being one unit over target versus one unit under target, and you will usually find an asymmetrical loss function. Consider this asymmetry when you set your targets.
Please email or phone me if you have comments or questions about this case.
--Robert B. Morrison, DVM, MBA, PhD
Swine Group, College of Veterinary Medicine; University of Minnesota,
St. Paul, Minnesota, 55108
BobM@UMN.Edu or 612-625-9276.