| Original research | Peer reviewed |
Effet du curcuma (Curcuma longa Linnaeus) sur les performances de croissance, la digestibilité des nutriments, les valeurs hématologiques, et l’histologie intestinale chez des porcelets en pouponnière
Cite as: Maneewan C, Yamauchi KE, Mekbungwan A, et al. Effect of turmeric (Curcuma longa Linnaeus) on growth performance, nutrient digestibility, hematological values, and intestinal histology in nursery pigs. J Swine Health Prod. 2012;20(5):231–240.
Also available as a PDF.
SummaryObjectives: To investigate the effects of dietary turmeric on growth performance, nutrient digestibility, hematological and biochemical values, and intestinal histology in nursery pigs. Materials and methods: A total of 48 nursery pigs were divided into groups receiving 0.00%, 0.05%, 0.10%, and 0.20% turmeric in the feed, with four replicates. Experiment 1: visceral organs and light microscopic parameters (eg, intestinal villus height) were measured at 30 kg body weight (BW). Epithelial cell morphology on the villus apical surface was observed using a scanning electron microscope. Experiment 2: blood was collected at 40 and 80 kg BW for hematology, triglyceride, and cholesterol assays. Growth performance was compared at 90 kg BW. Results: Growth performance and carcass and visceral organ weights did not differ between turmeric and control groups. Nutrient digestibility was higher in the 0.10% group (P < .05). Duodenal weight was lower in all treated groups than in the controls, and ileal weight was lower in the 0.10% and 0.20% groups (P < .05). At 80 kg BW, hematocrit was lower in the 0.10% group (P < .05). White blood cell counts were higher in the 0.10% and 0.20% groups, and triglycerides and cholesterol in all treated groups (P < .05). Cell mitosis numbers were higher in the jejunum and ileum of the 0.10% and 0.20% groups (P < .05). Protuberant mucosal epithelial cells and cell clusters were observed in treated groups. Implications: Under the conditions of this study, dietary turmeric promotes nutrient digestibility, enhances hematological values, and induces intestinal epithelial cell hypertrophy. | ResumenObjetivos: Investigar los efectos de la cúrcuma alimenticia en el desempeño de crecimiento, digestibilidad de nutrientes, valores bioquímicos y hematológicos, e histología intestinal en cerdos de destete. Materiales y métodos: Se dividieron un total de 48 cerdos de lactancia en grupos que recibieron 0.00%, 0.05%, 0.10%, y 0.20% de cúrcuma en el alimento, con cuatro réplicas. Experimento 1: se midieron órganos viscerales y parámetros microscópicos ligeros (por ejemplo, altura de las vellosidades intestinales) a 30 kg de peso corporal (BW por sus siglas in inglés). La morfología de las células epiteliales en la superficie apical de las vellosidades se observó utilizando un microscopio electrónico de barrido. Experimento 2: se recolectó sangre a los 40 y 80 kg BW para pruebas de hematología, triglicéridos, y colesterol. El desempeño del crecimiento se comparó a 90 kg BW. Resultados: El desempeño del crecimiento y la canal y los pesos de los órganos viscerales no difirieron entre los grupos de cúrcuma y control. La digestibilidad de nutrientes fue más elevada en el grupo 0.10% (P < .05). El peso duodenal fue más bajo en todos los grupos tratados comparados con los controles y el peso ileal fue más bajo en los grupos 0.10% y 0.20% (P < .05). A los 80 kg BW, el hematocrito fue más bajo en el grupo 0.10% (P < .05). El número de células blancas en la sangre fue más alto en los grupos 0.10% y 0.20%, y los triglicéridos y el colesterol en todos los grupos tratados (P < .05). Los números de mitosis celular fueron más altos en el yeyuno y en el ileón en los grupos 0.10% y 0.20% (P < .05). Se observaron células epiteliales protuberantes de mucosa y agrupamiento de células en los grupos tratados. Implicaciones: Bajo las condiciones de este estudio, la cúrcuma alimenticia promueve la digestibilidad de nutrientes, mejora los valores hematológicos, e induce la hipertrofia de la célula epitelial intestinal. | ResuméObjectifs: Étudier les effets de curcuma alimentaire sur les performances de croissance, la digestibilité des nutriments, les valeurs hématologiques et biochimiques, ainsi que l’histologie intestinale de porcelets en pouponnière. Matériels et méthodes: Un total de 48 porcelets en pouponnière ont été séparés en groupes recevant 0.00%, 0.05%, 0.10%, et 0.20% de curcuma dans leur alimentation, avec quatre réplications. Expérience 1: les viscères et des paramètres en microscopie photonique (eg, hauteur des villosités intestinales) ont été mesurés à 30 kg de poids vif (BW). La morphologie des cellules épithéliales à la surface apicale des villosités a été observée par microscopie électronique à balayage. Expérience 2: du sang fut prélevé à 40 et 80 kg de poids vif pour analyses hématologiques et mesures des triglycérides et du cholestérol. Les performances de croissance ont été comparées à 90 kg de BW. Résultats: Aucune différence dans les performances de croissance et le poids de la carcasse et des viscères n’a été observée entre le groupe témoin et les groupes avec supplément de curcuma. La digestibilité des nutriments était supérieure dans le groupe 0.10% (P < .05). Le poids du duodénum était plus petit dans tous les groupes traités comparativement aux témoins, et le poids de l’iléon était plus petit dans les groupes 0.10% et 0.20% (P < .05). À 80 kg BW, l’hématocrite était inférieur dans le groupe 0.10% (P < .05). Les dénombrements leucocytaires étaient plus élevés dans les groupes 0.10% et 0.20%, et les triglycérides et le cholestérol dans tous les groupes traités (P < .05). Le nombre de cellules mitotiques était plus grand dans le jéjunum et l’iléon des groupes 0.10% et 0.20% (P < .05). Des cellules épithéliales de la muqueuse protubérantes et des amas cellulaires furent observés dans tous les groupes traités. Implications: Dans les conditions expérimentales de la présente étude, le curcuma alimentaire favorise la digestibilité des nutriments, augmente les valeurs hématologiques, et induit l’hypertrophie des cellules épithéliales intestinales. |
Keywords: swine, turmeric, nutrient digestibility, hematological and biochemical values, intestinal histology
Search the AASV web site
for pages with similar keywords.
Received: December 1, 2011
Accepted: April 24, 2012
To improve commercial swine production, basal diets have been supplemented with antibiotics for disease prevention and control of pathogens. However, continued use of antibiotics has induced development of resistant bacteria.1 Consequently, it has become necessary to develop alternatives, such as dietary natural resources, to enhance intestinal physiological functions. To evaluate these feed ingredients, nutritional-physiological assessments have been made,2 for example, experiments to determine the effects of dietary supplements on the growth and health of the animal. The digestive, absorptive, and immunological functions of the intestine make it an essential organ in maintaining animal health. It is possible that histological changes observed in the intestinal mucosa are associated with changes in function. Recently, a histological approach for evaluating poultry diets has shown that greater villus height, cell area, and cell mitosis number, and the presence of protuberant cells (enlarged epithelial cells that protrude from the villus tip) were intimately related to activated intestinal digestive and absorptive functions.2
Curcuma longa Linnaeus, a plant in the ginger and galingale family, is cultivated in tropical regions for medicinal purposes. The rhizome is usually boiled, cleaned, and dried to yield a yellow powder called “turmeric.” Curcumin, the major pigment in turmeric,3 has been widely used as a spice, a yellow coloring agent in food, and a food preservative. Turmeric has medicinal properties including antifungal,4 immunomodulatory,5 and antioxidative6 activities, and has been used in ruminants to prevent endoparasites and to treat internal and external injuries.6 Studies on growth performance reported no improved performance in piglets,7 broilers,8 and rats 9 receiving supplemental turmeric. Carcass characteristics of broilers, including pre-slaughter live weight, New York dressed weight, eviscerated carcass weight, giblet weight, ready-to-cook carcass weight, and abdominal fat percentage revealed no significant differences from untreated controls when 0.1% and 0.2% dietary turmeric was fed,10 but carcass characteristics were better in broilers fed 0.5% dietary turmeric.11 Although most turmeric studies have focused on performance, few have been identified with a focus on nutrient digestibility, hematological values, and intestinal histology. Therefore, the objective of this study was to investigate the effects of turmeric on growth performance, carcass and visceral organs weights, hematological and biochemical values, and intestinal histology both in nursery and growing-finishing pigs.
Materials and methods
All experimental procedures and animal management were performed according to the Guidelines and Rules for Animal Experiments of Maejo University, Thailand, and according to the Ethical Principles and Guidelines for the Use of Animals for Scientific Purposes, National Research Council of Thailand.
Animals and housing
Pigs were crossbreds (Large White × Landrace × Duroc) weaned at 28 days of age. Two feeding experiments, Experiments 1 and 2, were carried out separately but during the same rainy season at Maejo University, Thailand, June to October (average temperature 28.5°C, lowest 23°C, range 20°C to 25°C, and highest 35°C, range 32°C to 38°C; relative humidity 58%, range 45% to 84%). Pigs entered both experiments at approximately 50 to 60 days of age, body weight (BW) approximately 15 kg, and were housed in concrete pens (1.5 × 2.0 m) with fully slatted floors. Fans operated automatically when ambient temperature was over 28°C. Each pen was provided with two nipple waterers and one automatic feeder for ad libitum feed. During both experiments, three basal diets were provided: a nursery diet from 15 to 30 kg BW, a grower diet to 60 kg, and a finisher diet to 90 kg12 (Table 1).
Table 1: Feed composition of basal diet (as fed) in pigs supplemented or not with turmeric (Experiments 1 and 2)*
* Nursery pigs: 15-30 kg; growers, 31-60 kg; finishers, 61-90 kg. † Premix supplied per kg diet: vitamin A, 3333 IU; vitamin D, 667 IU; vitamin E, 0.33 mg; vitamin K, 0.66 mg; vitamin B2, 1.67 mg; vitamin B12, 0.003 mg; calcium pantothenate, 6.67 mg; cobalt, 3.47 mg; copper, 27.60 mg; iodine, 0.77 mg; manganese, 18.47 mg; zinc, 50.00 mg; and iron, 60.00 mg. |
Experimental design, Experiment 1
A total of 16 castrated male nursery pigs were housed in one pen to 20 kg BW, then moved to individual stainless steel metabolism cages (1.5 × 2 m) and randomly divided into four study groups with four replicates of one pig each. The Control group received no dietary turmeric. The other three groups received turmeric at 0.05%, 0.10%, and 0.20% of the diet, respectively. At 25 kg BW (approximately 70 to 75 days of age), pigs were fed their respective experimental diets supplemented with 1% chromic oxide as a marker for 3 days, and feces were collected to measure nutrient digestibility for 7 days. Pigs were then returned to group housing in pens.
The nutrient digestibility parameters of both feed and feces were determined. Dry matter, crude protein, crude fat, crude fiber, ash, nitrogen-free extract, energy, and biological value of protein were analyzed according to Association of Official Analytical Chemists procedures.13 At 30 kg body weight (approximately 85 to 90 days of age), all pigs were euthanized with 20 to 30 mg sodium pentobarbital per kg BW, and visceral organs were quickly removed for gross anatomical examination, as well as for light and scanning electron microscopy of the small intestinal mucosa.
Tissue sampling
The abdominal cavity was opened along the midline immediately after the pigs were euthanized. A 5-cm sample of the duodenum was collected, approximately 10 to15 cm distal to the stomach, and a 5-cm sample of the ileum was collected approximately 20 cm proximal to the ileocecocolic junction. A 5-cm sample was collected at the midpoint of the remaining small intestine, which was regarded as the jejunum. Each sample was ligated at both ends, and a mixture of 30 mL per L glutaraldehyde and 40 mL per L paraformaldehyde in 0.1 M cacodylate buffer (pH 7.4) was injected. Each sample was then removed from the abdominal cavity and stored in the same fixative for 2 hours until preparation for light and scanning electron microscopy. During this 2 hours, the remaining visceral organs were extracted from the abdominal cavity and gross anatomy of the carcass and visceral organs was examined.
Gross anatomical examination
Using an electronic scale accurate to 0.1 g, carcass weight and weights of other visceral organs (heart, liver, kidneys, spleen, lungs, and stomach) were measured. Intestinal content was removed and the length and weight of the remaining intestinal segments were measured. Ratio of small intestinal weight to length was calculated.
Light microscopy
A 5 × 8-mm section from each 5-cm intestinal sample was fixed with Bouin’s fixative solution (saturated solution of picric acid, 375 mL; formaldehyde buffered with CaCO3, 125mL; and acetic acid, 25 mL) for 1 week at room temperature, embedded in Paraplast Plus (Sigma-Aldrich Co, St Louis, Missouri), and cut into 5-μm cross sections using a microtome. Every 10th section was collected and stained with hematoxylin-eosin.
Villus height, excluding the intestinal crypt, was measured in two villi in each section. Villi that included the lamina propria were selected at 40× magnification. Sixteen values of villus height were obtained from eight sections per pig, and the average of these values was expressed as the mean villus height for each pig.
To measure villus area, the width of the villus was measured at the base and apex. Villus area was calculated from villus height, basal width, and apical width.14 Two villi that included lamina propria were selected at 40× magnification for each section per pig. Sixteen values of villus area were obtained from eight sections per pig, and the mean villus area per pig was the average of these values.
To measure one cell area on the 5-µm cross section, the area of the epithelial cell layer was measured in the middle of a villus that included lamina propria, and the number of cell nuclei within this layer was counted. The area of the epithelial cell layer was then divided by this number. This measurement was employed in one to two fields per section. Sixteen values of cell area were obtained from eight sections per pig, and the mean cell area per pig was the average of these values.
To measure the cell mitosis number per crypt, five crypts with the approximate size of one microscopic field (400× magnification) were selected from four different sections for each pig and these four values were used to calculate the mean for that pig. Finally, these four mean values from four pigs were expressed as mean cell mitosis for one treatment.
These measurements were recorded using an image analyser (Olysia image analyser; Olympus Co Ltd, Tokyo, Japan). Finally, the mean of each intestinal parameter from the respective four pigs per treatment was expressed as the mean villus height, villus area, cell area, number of cell mitoses, crypt depth, muscle thickness, and ratio of villus height to crypt depth for one group.
Scanning electron microscopy
A 2 × 3-cm segment from the 5-cm duodenal segment proximal to the light microscopic sample was slit longitudinally along its nonmesenteric side for its entire length. The intestinal contents were washed with 0.01 M phosphate-buffered saline (pH 7.4). The tissue samples were pinned flat to prevent curling and fixed in a mixture of 3% glutaraldehyde and 4% paraformaldehyde in 0.1 M cacodylate buffer (pH 7.4) at room temperature for 1 hour. A 4 × 7-mm rectangle was cut from each tissue block and was fixed for an additional hour. The pieces were rinsed with 0.1 M sodium cacodylate buffer (pH 7.4) and post fixed with 10 g per L osmium tetroxide in ice-cold buffer for 2 hours. The specimens were dried in a critical-point drying apparatus (Polaron CPD apparatus7501; Quorum Technologies Ltd, East Sussex, United Kingdom). The dried specimens were coated with platinum (Hitachi E-1030 Ion Sputter; Hitachi Ltd, Tokyo, Japan) and observed with a JSM-5401LV scanning electron microscope (JEOL, Tokyo, Japan). Mucosal epithelial cells originate in the intestinal crypt, and the exfoliative zone around the centre of the villus apical surface is the final stage of cell life. Therefore, the morphological alterations of epithelial cells were observed around the central part of the apical surface.
Experimental design, Experiment 2
A total of 32 crossbred pigs, 16 females and 16 castrated males, were used. Sixteen nursery pigs of each gender were randomly allocated into four experimental groups housed in separate pens. Three groups, each including four males and four females, received turmeric as a dietary supplement at 0.05%, 0.10%, and 0.20%, and a control group received no turmeric (0.00%), with four replicates of one female and one male per replicate. Measurements of growth performance were made up to 90 kg BW (approximately 175 to 185 days of age).
Individual body weight and feed intake were measured once a week. An index of average daily gain (ADG) in each group was calculated, with the ADG of the controls expressed as an index of 100. Feed intake was calculated for each pen by subtracting the feed remaining in the feeder from the amount fed. Feed conversion ratio was calculated using the following formula: feed intake (kg) ÷ ADG (kg). At 40 kg BW (approximately 105 days of age) and 80 kg BW (approximately 160 days of age), blood was collected from the jugular vein into 10-mL evacuated tubes containing EDTA and stored on ice until assayed. Hematocrits were performed by the microhematocrit method. White blood cell counts were performed using a light microscope. Neutrophil to lymphocyte (N:L) ratio was calculated from numbers of neutrophils and lymphocytes. The blood samples were then centrifuged at 2000g at 4°C for 20 minutes within 1 hour of collection to separate the plasma, and triglyceride and cholesterol assays were performed using colorimeteric assays (Biotech Reagent, Bangkok, Thailand).
Statistical analysis
Data on growth performance, nutrient digestibility, carcass and visceral organ weights, hematological and biochemical values, and light microscopic parameters obtained in Experiments 1 and 2 were analyzed as a one-way ANOVA using the general linear models procedure of SAS software (SAS Institute Inc, Cary, North Carolina), and results were expressed as means and pooled standard error of the mean. A separate analysis was performed employing orthogonal polynomial contrasts to determine the effects of graded levels of dietary turmeric on growth performance, nutrient digestibility, carcass and visceral organ weights, hematological values, biochemical values, and light microscopic intestinal parameters. A probability < .05 was considered significant and < .10 was considered a trend.
Results
Experiment 1
Nutrient digestibility. Nutrient digestibility of dry matter and energy did not differ significantly among the groups (Table 2). Digestibility of crude protein, crude fat, ash, and the biological value of the protein increased with increasing level of dietary turmeric, and were higher in the 0.10% and 0.20% groups than in the control (Table 2). Digestibility of crude fiber was also higher in the 0.10% and 0.20% groups (Table 2).
Table 2: Nutrient digestibility in nursery pigs fed diets supplemented with turmeric at 0.00% , 0.05%, 0.10%, and 0.20% (Experiment 1)*
* Study period from approximately 50 to 60 days of age to approximately 85 to 90 days of age. Controls received the basal diet (described in Table 1) unsupplemented with turmeric. Four castrated males per treatment group (16 pigs total). One replicate represented by one pig per treatment, with four replicates performed. † In each treatment group, nursery pigs weighing 25 kg were confined in metabolism cages for administration of 1% chromic oxide in the feed (3 days) and collection of feces (7 days). ‡ Linear and quadratic polynomial contrasts were used to determine the effects of increasing levels of dietary turmeric. SEM = standard error of the mean. |
||||||||||||||||||||||||||||||||||||||||||||||||||||||||||||||||||||||||||||||||||
Carcass and visceral organs. The weights per kg of live body weight of the carcass and visceral organs (heart, liver, kidney, spleen, lung, and stomach), and small intestinal length, did not differ among groups (Table 3). Duodenal weights were lighter in all treated groups (P < .01) and ileal weight was lighter in the 0.10% and 0.20% groups (P < .05) than in the control. The ratio of weight to length in the duodenum, jejunum, and whole intestine did not differ among treatment groups, but was lower in the ileum of groups supplemented with turmeric (Table 3).
Table 3: Measurements of carcass and visceral organs in nursery pigs fed diets supplemented with turmeric at 0.00% , 0.05%, 0.10% and 0.20% (Experiment 1)*
* Study described in Table 2. Pigs were euthanized at 30 kg body weight for gross and microscopic examination of the visceral organs and intestinal tract. Four replicates performed per group, with one pig per group in each replicate. † Linear and quadratic polynomial contrasts were used to determine the effects of increasing levels of dietary turmeric. SEM = standard error of the mean. |
||||||||||||||||||||||||||||||||||||||||||||||||||||||||||||||||||||||||||||||||||||||||||||||||||||||||||||||||||||||||||||||||||||||||||||||||||||||||||||||||||||||||||||||||||||||||||||||||||||||||||||||
Light microscopic villus measurements. Villus height, villus epithelial cell area, crypt depth, thickness of total muscle layer, and ratio of villus height to crypt depth did not differ among groups. Numbers of cell mitoses per crypt in the duodenum were lower in the 0.10% group (P < .01), but higher in the jenunum and ileum of the 0.10% and 0.20% groups (Table 4). The total muscle layer was thinner in the duodenum of the 0.05%, 0.10%, and 0.20% groups than in the control (P < .05) (Table 4).
Table 4: Light microscopic intestinal parameters in pigs fed 0.00%, 0.05%, 0.10% and 0.20% dietary turmeric (Experiment 1)*
* Study described in Tables 2 and 3. Four replicates performed per group, with one pig per group in each replicate. † Linear and quadratic polynomial contrasts were used to determine the effects of increasing levels of dietary turmeric. SEM = standard error of the mean; ND = not done: not included in statistical analysis. |
||||||||||||||||||||||||||||||||||||||||||||||||||||||||||||||||||||||||||||||||||||||||||||||||||||||||||||||||||||||||||||||||||||||||||||||||||||||||||||||||||||||||||||||||||||||||||||||||||||||||||||||
Scanning electron microscopic observation of epithelial cells on the villus apical surface
Figures 1 to 3 show epithelial cells on the intestinal villus apical surface in piglets fed 0.0%, 0.05%, 0.10%, and 0.20% turmeric diets. Compared with the slightly protuberant cells of the duodenum in the control (Figure 1A), the cells of all turmeric groups protruded into the intestinal lumen, ie, had a dome-like appearance (Figures 1B and 1C). In addition, cell clusters composed of aggregated protuberant cells were observed in the 0.20% group (Figure 1D). In the jejunum, the control was covered with flat cells (Figure 2A), but in the 0.05% group, there was a distribution of slightly protuberant cells (Figure 2B), and in the 0.10% and 0.20% groups (Figures 2C and 2D, respectively), there were clearly protuberant cells. In the ileum, the control was covered with flat cells (Figure 3A), but in the 0.05% and 0.10% groups (Figures 3B and 3C, respectively), there were distributions of slightly protuberant cells, and in the 0.20% group (Figure 3D), there were clearly protuberant cells.
Figure 1: Duodenal villus apical surface of 85- to 90-day-old nursery pigs fed diets supplemented with turmeric at 0.00%, 0.05%, 0.10%, and 0.20% (panels A, B, C, and D, respectively). Pigs were weaned at 28 days of age and entered the study at approximately 50 to 60 days of age. Black arrows: slightly protuberant cells; white arrows: protuberant cells; stars: cell clusters. Bar = 6150 µm. 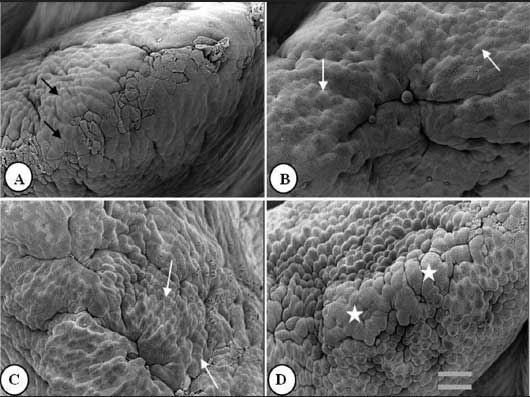 |
Figure 2: Jejunal villus apical surface of nursery pigs described in Figure 1 and fed diets supplemented with turmeric at 0.00% , 0.05%, 0.10%, and 0.20% (panels A, B, C, and D, respectively). Protuberant cells are visible in panels B, C, and D. Bar = 6150 µm. 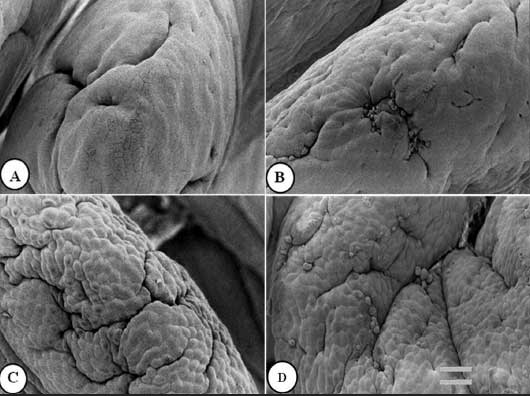 |
Figure 3: Ileal villus apical surface of nursery pigs described in Figure 1 and fed diets supplemented with turmeric at 0.00% , 0.05%, 0.10%, and 0.20% (panels A, B, C, and D, respectively). Protuberant cells are visible in panels B, C, and D. Bar = 6150 µm. 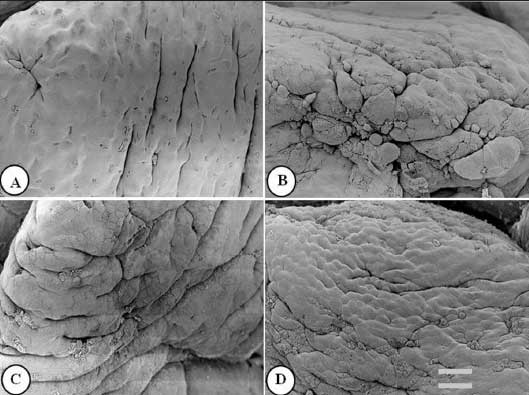 |
Experiment 2
Growth performance. Average daily gain and feed conversion did not differ among the groups (Table 5). Overall feed intake was greater in the 0.05% and 0.20% groups (P < .05).
Table 5: Growth performance in pigs fed diets supplemented with turmeric at 0.00% , 0.05%, 0.10%, and 0.20% at the nursery, grower, and finisher phases of production (Experiment 2)*
* Study period from approximately 50 to 60 days of age to approximately 175 to 185 days of age. Controls received the basal diet (described in Table 1) unsupplemented with turmeric. Two castrated males and two females per treatment group; one replicate was represented by one male and one female per treatment group, with four replicates performed. Nursery pigs weighed 15-30 kg, growing pigs weighed 31-60 kg, and finishing pigs weighed 61-90 kg. † Linear and quadratic polynomial contrasts were used to determine the effects of increasing levels of dietary turmeric. ‡ Feed conversion ratio = feed intake (kg) ÷ body weight gain (kg). SEM = standard error of the mean |
||||||||||||||||||||||||||||||||||||||||||||||||||||||||||||||||||||||||||||||||||||||||||||||||||||||||||||||||||||||||||||||||||||||
Hematological and biochemical values. Table 6 shows the hematological and biochemical values of each group at 40 and 80 kg BW. Mean hematocrits in the treated groups did not differ from that of the control at 40 kg BW, but hematocrit was lower in the 0.10% group at 80 kg BW. Total white blood cell count and numbers of eosinophils and lymphocytes were greater with increasing levels of dietary turmeric (P < .01). Numbers of neutrophils, basophils, and monocytes were higher in the 0.10% and 0.20% groups than in the control group (P < .01). Neutrophil:lymphocyte ratio did not differ among the groups (Table 6). In 80-kg pigs, triglycerides (P < .05) and cholesterol concentrations (P < .001) were higher in treated groups.
Table 6: Hematological and biochemical values in growing pigs fed 0.00%, 0.05%, 0.10%, and 0.20% dietary turmeric (Experiment 2)*
* Study described in Table 5. Four replicates performed per group, with two castrated males and two females per group in each replicate. Blood samples were collected by jugular venipuncture into evacuated tubes containing EDTA. † Linear and quadratic polynomial contrasts were used to determine the effects of increasing levels of dietary turmeric. ‡ Hematocrit was determined by the microhematocrit method, and white blood cells were counted using the chamber method and a light microscope. ¶ Plasma triglycerides and cholesterol were assayed using a colorimetric method (Biotech Reagent, Bangkok, Thailand). SEM = standard error of the mean; BW = body weight; N:L = neutrophil to lymphocyte ratio. |
||||||||||||||||||||||||||||||||||||||||||||||||||||||||||||||||||||||||||||||||||||||||||||||||||||||||||||||||||||||||||||||||||||||||||||||||||||||||||||||||||||||||||||||||||||||||||||||||||||||||||||||||||||||||||||||||||||||||||||||||||||||||||||||
Discussion
Growth performance in broilers was not improved after feeding 0.25%, 0.50%, and 0.75% dietary turmeric.8 In other poultry studies, carcass characteristics did not differ in 0.1% and 0.2% dietary turmeric groups,10 but carcass characteristics were better in a group fed 0.5% dietary turmeric.11 Growth performance in piglets fed a diet containing 0.02% curcumin was not better than that of the control.7 Although in the present study, digestibilities of crude protein, crude fat, and crude fiber, and the biological value of protein, all increased with increasing level of dietary turmeric, growth performance and carcass weight did not differ among groups. One consequence of extracting curcumin from turmeric3 was that it required a longer period of supplementation to elicit an effect when used in lower doses in piglets.7 It is possible that the present experimental feeding period of approximately 4 months was not long enough to have a significant effect on weight gain. When the ADG of the control group (0.63 kg per day) was set at 100, ADG indexes of the 0.05%, 0.10%, and 0.20% groups (0.69, 0.65, and 0.67 kg per day, respectively) were 110, 103, and 106, respectively. For the poultry producer, 2% higher daily gain is a sufficient increase.
In the present study, intestinal weight in turmeric groups was lower than that in the control group. In chickens fed high protein diets, intestines were short and light compared to controls, and there were higher numbers of cell mitoses and protuberant cells.15,16 The facts that in this study, digestibility of crude protein was higher, duodenal and ileal weights were lower, numbers of cell mitoses were higher in the jejunum and ileum, and there were more protuberated cells in the turmeric groups than in the control group, might suggest that turmeric stimulates small intestinal function.
Measurement of hematological parameters is essential to evaluate animal health and stress. High leukocyte numbers and N:L ratios indicate a stress response.17 In pigs fed metapyrone, a drug used to diagnose adrenal insufficiency and to block cortisol synthesis, percentage of neutrophils increased and percentage of lymphocytes decreased; in every case, the N:L ratio increased.18 In pigs positive for swine influenza by polymerase chain reaction, total white blood cell count and the N:L ratio decreased.19 Growth performance and nutritional digestibility in growing-finishing pigs were better when fermented garlic powder was added to the feed, and immunoglobulins and lymphocyte counts were higher.20 Serum triglycerides and aortic cholesterol were lower in stressed rats than nonstressed controls.21 These reports suggest that lower neutrophil counts and N:L ratios, higher lymphocyte counts and total white cell counts, and higher serum triglycerides and cholesterol indicate no stress response. In the present study, pigs fed turmeric had higher total white blood cell counts and triglycerides than did controls. In Balb/c mice, feeding curcumin (the major pigment in turmeric3) was associated with higher total white cell counts, higher circulating antibody titer against sheep red blood cells, and greater phagocytic activity in macrophages,5 and greater B-lymphocyte proliferation in the intestinal mucosa.22 These reports suggest that ingested turmeric improves health in treated pigs because of enhanced immunostimulatory activity.
Intestinal histomorphology is markedly affected by dietary feed components, and changes in intestinal morphology correlate well with intestinal function in piglets22-24 and chickens.25 Intestinal villus height, epithelial cell area, and number of cell mitoses were lower in pigs fed raw pigeon pea seed meal than in untreated controls, but values of these parameters were higher in groups of pigs fed heated pigeon pea seed meal than in pigs fed raw pigeon pea seed meal.24 Neither villus height nor crypt depth was influenced in 20-day-old piglets fed 0.02% dietary curcumin.7 In the present study, most light microscopic parameters did not differ, with the exception of cell mitosis numbers, which were higher in the 0.10% and 0.20% groups in the jejunum and ileum, the most absorptive sections of the intestine. In a study in chickens after jejunal or ileal resection,2 intestinal absorptive function was enhanced, and mucosal epithelial cell mitosis numbers were higher than in the control. In addition, villus-to-crypt ratio was higher in the experimental groups. It is reported that an increase in the villus-to-crypt ratio corresponds to an increase in digestion and absorption,2 and that maximum digestion and absorption occur at an increasing distance along the crypt:villus axis in the weaned pig.26 These results and related reports suggest that the intestinal villi would be hypertrophied in pigs treated with turmeric.
More protuberant cells were seen among the epithelial cells on the villus apical surface in the three dietary turmeric groups than in the control group. In addition, cell clusters, which are accumulations of protuberant cells, appeared in the 0.20% turmeric group. These protuberant cells have been observed in chickens2 and piglets27,28 in association with high digestibility of nutrients, and cell clusters were observed in the intestines of chickens with greater BW gain than the controls,29 suggesting that intestinal epithelial cells may hypertrophy when turmeric is fed. Hypertrophy of epithelial cells might be induced by the improved intestinal lumen environment associated with the medicinal functions of turmeric, eg, antifungal, 4 immunomodulatory,5 and antioxidative activities.3
The results of this study suggest that feeding turmeric to growing swine stimulates function of the intestinal epithelial cells, and absorbed turmeric may enhance hematological values with resulting optimization of general health.
Implications
• Dietary turmeric promotes nutrient digestibility, enhances hematological values, and induces hypertrophy of intestinal mucosal epithelial cells in growing pigs.
References
1. Sørum H, Sunde M. Resistance to antibiotics in the normal flora of animals. Vet Res. 2001;32:227–241.
2. Yamauchi KE, Incharoen T, Yamauchi K. The relationship between intestinal histology and function as shown by compensatory enlargement of remnant villi after midgut resection in chickens. Anat Rec. 2010;293:2071–2079.
3. Osawas T, Sugiyama Y, Inayoshi M, Kawakishi S. Antioxidative activity of lower tetrahydro-curcuminoids. Biosci Biochem. 1995;59:1609–1612.
4. Wuthi-udomler M, Grisanapan W, Luanratana O, Caichompoo W. Antifungal activity of Curcuma longa grown in Thailand. Southeast Asian J Trop Med Public Health. 2000;31(suppl 1):178–182.
5. Antony S, Kuttan R, Kuttan G. Immunomodulatory activity of curcumin. Immunol Invest. 1999;28:291–303.
6. Lans C, Brown G. Ethnoveterinary medicines used for ruminants in Trinidad and Tobago. Prev Vet Med. 1998;35:149–163.
7. Ilsley SE, Miller HM, Kamel C. Effects of dietary quillaja saponin and curcumin on the performance and immune status of weaned piglets. J Anim Sci. 2005;83:82–88.
8. Emadi E, Kermanshahi H. Effect of turmeric rhizome powder on performance and carcass characteristics of broiler chickens. Int J Poult Sci. 2006;5:1069–1072.
9. Platel K, Srinivansan K. Influence of dietary spices or their active principles on digestive enzymes of small intestinal mucosa in rats. Int J Food Sci Nutr. 1996;47:55–59.
10. Mehala C, Moorthy M. Effect of Aloe vera and Curcuma longa (Turmeric) on carcass characteristics and biochemical parameters of broilers. Int J Poult Sci. 2008;7:857–861.
11. Singh N, Singh JP, Singh V. Effect of dietary supplementation of herbal formulation on dressing percentage and mortality in broiler chicks. Indian J Field Vet. 2007;2:22–24.
12. National Research Council. Nutrient Requirements of Swine. 10th rev ed. Washington, DC: National Academy Press; 1998:111–123.
13. AOAC. Official Method of Analysis. 16th ed. Washington, DC: Association of Official Analytical Chemists; 1995.
14. Iji PA, Saki A, Tivey DR. Body and intestinal growth of broiler chicks on a commercial starter diet. 1. Intestinal weight and mucosal development. Br Poult Sci. 2001;505–513.
15. Buwjoom T, Yamauchi K, Erikawa T, Goto H. Histological intestinal alterations in chickens fed low protein diet. J Anim Physiol Anim Nutr. 2009;94:354–361.
16. Incharoen T, Yamauchi K, Erikawa T, Gotoh H. Histology of intestinal villi and epithelial cells in chickens fed low protein or low fat diets. Ital J Anim Sci. 2010;9:e82. doi:10.4081/ijas.2010.e82.
17. Roth JA. Cortisol as mediator of stress-associated immunosuppression in cattle. In: Moberg G, ed. Animal Stress. Bethesda, Maryland: American Physiological Society. 1985:225–243.
18. Salak JL, McGlone JJ, Norman RL. In vitro glucocorticoid effects on porcine natural killer cell activity and circulating leukocytes. J Anim Sci. 1996;584–592.
19. Indavarapu A, Akinapelli A. Neutrophils to lymphocyte ratio as a screening tool for swine influenza. Indian J Med Res. 2011;134:389–391.
20. Yan L, Meng QW, Kim IH. Effects of fermented garlic powder supplementation on growth performance, nutrient digestibility, blood characteristics and meat quality in growing-finishing pigs. Anim Sci J. 2011. doi:10.1111/j.1740–0929.2011.00973.x.
21. Starzec JJ, Berger DF. Effects of stress and ovariectomy on the plasma cholesterol, serum triglyceride, and aortic cholesterol levels of female rats. Physiol Behav. 1986;37:99–104.
22. Churchill M, Chadburn A, Bilinski RT, Bertagnolli MM. Inhibition of intestinal tumors by curcumin is associated with changes in the intestinal immune cell profile. J Surg Res. 2000;89:169–175.
23. Cera KR, Mahan DC, Cross RF, Reinhart GA, Whimoyer RE. Effect of age, weaning and postweaning diet on small intestinal growth and jejunal morphology in young swine. J Anim Sci. 1988;66:574–584.
24. Mekbungwan A, Yamauchi K. Growth performance and histological intestinal alterations in piglets fed dietary raw and heated pigeon pea seed meal. Histol Histopathol. 2004;19:381–389.
25. Meimandipour A, Hair-Bejo M, Shuhaimi M, Azhar K, Soleimani AF, Rasti B, Yazid AM. Gastrointestinal tract morphological alteration by unpleasant physical treatment and modulating role of Lactobacillus in broilers. Poult Sci. 2010;51:52–59.
26. Montagne L, Pluske JR, Hampson DJ. A review of interactions between dietary fibre and the intestinal mucosa and their consequences on digestive health in young non-ruminant animals. Anim Feed Sci Techol. 2003;108:95–117.
27. Pluske JR, Thompson MJ, Atwood CS, Bird PH, Williams IH, Hartmann PE. Maintenance of villus height and crypt depth, and enhancement of disaccharide digestion and monosaccharide absorption, in piglets fed on cows’ whole milk after weaning. Br J Nutr. 1996;76:409–422.
28. Mekbungwan A, Yamauchi K, Thongwittaya N. Digestibility of soybean and pigeon pea seed meals and morphological intestinal alterations in pigs. J Vet Med Sci. 2004;66:627–633.
29. Khambualai O, Yamauchi K, Ruttanavut J, Incharoen T, Kashimura J. Effect of sugar cane extract, commercial probiotic and their mixture on growth performance and intestinal histology in broiler chickens. Am J Anim Vet Sci. 2010;5:132–138.