Original research |
Peer reviewed |
The impact of feeder adjustment and group size-floor space allowance on the performance of nursery pigs
Laura F. Smith, BSA; A. Denise Beaulieu, PhD; John F. Patience, PhD; Harold W. Gonyou, PhD; R. Dean Boyd, PhD
LFS, ADB, JFP, HWG: Prairie Swine Centre Inc, Saskatoon, Saskatchewan, Canada; RDB: Pig Improvement Co, Franklin, Kentucky; Corresponding author: Dr A. Denise Beaulieu, Prairie Swine Centre, Inc, PO Box 21057, 2105 8th St E, Saskatoon, Saskatchewan, Canada S7H 5N9; Tel: 306-667-7441; Fax: 306-955-2510; E-mail: beaulieu@sask.usask.ca
Cite as: LF, Beaulieu AD, Patience JF, et al. The impact of feeder adjustment and group size-floor space allowance on the performance of nursery pigs. J Swine Health Prod. 2004;12(3):111-118.
Also available as a PDF.
Summary
Objectives: To determine the effects of group size and feeder trough opening on weanling pig performance, and to develop feeder adjustment recommendations for the pork industry.
Materials and methods: Weanling piglets were randomly assigned to three group sizes (16, 20, and 24 pigs), with corresponding floor space allowances of 0.35 m2, 0.28 m2, and 0.23 m2 per pig. Crumbled feed was provided in trough-type dry feeders using five different feeder gap openings (range 9.2 - 31.5 mm) for 42 days, beginning 8 days postweaning. Three replicates were performed (N = 716).
Results: During Days 21 to 42, body weight, ADG, and average daily feed intake increased with feeder gap size and floor space allowance (P < .05). By day 42, pigs in pens with the widest feeder gap weighed 10% more than pigs in pens with the smallest gap (P < .001). Pigs with the greatest space allowance (0.35 m2) were 5.6% heavier than pigs with the least amount of space (0.23 m2; P < .05).
Implications: Under the conditions of this study, increasing space allowance from 0.23 m2 per pig to 0.35 m2 per pig was associated with increased body weight at approximately 10 weeks of age. Optimal growth and feed efficiency were observed when the feeder gap opening allowed 25 to 60% of the feeder trough to be consistently clear of feed. The capacity of a nursery feeder space is 11 pigs when the feeder gap opening allows 25 to 60% of the feeder trough to be clear of feed.
Keywords: swine, feeder,
space, nursery, performance
Search the AASV web site
for pages with similar keywords.
Received: October
2, 2002
Accepted: March
25, 2003
Nursery management is a particu- larly critical area of pig produc- tion. Achieving a smooth transition from farrowing through weaning is essential. Moreover, growth during the nursery period affects final weights at market. In one report, pigs that were 1 kg heavier at 11 weeks of age were 1.5 to 1.8 kg heavier at 17 weeks of age.1
Two important aspects of nursery management are feeder adjustments and group size. Adjustment of the feeder trough opening (feeder gap) may influence both feed consumption and feed wastage. Moreover, if accessing feed becomes difficult, individual pigs spend more time at the feeder, and the number of pigs able to obtain sufficient feed diminishes.2 Group size is directly related to floor space allocation, which is particularly important during this period of rapid growth. Crowding has negative impacts on feed intake and growth,3-6 and may exacerbate social vices such as tail biting, side nudging, and ear chewing.7
Few reports exist concerning floor space allowance and feeder gap opening, especially for the current high-lean genetics and newer housing systems. This study focused on the interaction between feeder gap adjustment and floor space allowance.
Materials and methods
Animals and diets
Piglets (C15 female x line 65 boar; Pig Improvement Canada, Acme, Alberta, Canada) weaned at an average age of 18.2 days and a mean weight of 6.4 kg were selected for the experiment on the basis of gender and weight uniformity. The piglets were obtained from groups weaned in 3 consecutive weeks at Prairie Swine Center (PSC) Elstow Research Farm in Saskatchewan, Canada. A commercial feeding program based on wheat and soy meal (formulated by PSC Elstow, manufactured by Federated Co-operatives Ltd, Saskatoon, Saskatchewan, Canada) was employed. A phase 1 diet was fed for the initial 4 days postweaning, followed by a phase 2 diet for 3 weeks, and a phase 3 diet for the remainder of the 42-day experiment. All three diets were formulated to appropriate energy and amino acid specifications for pigs of this age, and the phase 1 and phase 2 diets contained more animal protein. The feed was provided as a crumble except during the fourth week for the first group of pigs, when it was mistakenly manufactured and fed as a short-cut pellet.
Housing
Pigs were housed in three identical nursery rooms at PSC Elstow Research Farm, a 600-sow farrow-to-finish farm in central Saskatchewan. Each nursery room contained 16 pens, 3.05 m x 1.83 m (5.58 m2), with totally slatted plastic flooring and solid PVC pen dividers and front gates. The 12 noncorner pens of each room were used for the experiment. Each pen was equipped with one multi-space, trough-type dry feeder (Generation 3; Staco, Shafferstown, Pennsylvania), which was divided into six eating spaces by nose barriers 15 cm apart. Wooden blocks were inserted into the feeder to provide one functional feeder space per four pigs regardless of the number of pigs in the pen. Feeders were checked two or three times daily to ensure that they were functioning properly and that feed was available. Water was provided by a single nipple-type drinker fastened to the wall at the rear of the pen. A 12-hour light, 12-hour dark lighting regime was used, with lights on at 7:00 am.
Treatments
Group sizes were chosen to provide specific floor space allowances. A group size of 16 pigs per pen provided 0.35 m2 per pig, which approximates the floor space allowance specified in the Canadian Code of Practice.8 A group size of 24 provided only 0.23 m2 per pig, which is considered very crowded. An intermediate group size of 20 pigs per pen allowed 0.28 m2 per pig. Since both group size and floor space allowance changed with each treatment, they are confounded, and we refer to these treatments as group size-density.
Feeder gap openings were selected during a preliminary trial to determine the manu-facturer's setting required to achieve the four desired gap openings. Observations were made of pigs of different ages housed for 1 week in three rooms similar to those used in the study, and fed the same crumbled diet. A lever device is provided on the side wall of the Generation 3 feeders used in this experiment, to adjust the opening which allows the feed to flow into the trough. Level one was defined as the adjustment that allowed only a small bead of feed to be present in the feeder tray next to the delivery slot. Level four was defined as the adjustment that allowed the feeder tray to be constantly full, and levels two and three were intermediate. At the completion of the preliminary period, it was concluded that these four levels were achieved with gap openings of 9.2, 11.8, 17.9, and 24.8 mm. However, during the first replicate of the experiment, it was found that the gap opening of 9.2 mm restricted access to feed to a degree that compromised animal welfare. In subsequent replicates, the smallest gap opening used was 11.8 mm and the largest was 31.5 mm. The openings used corresponded to the manufacturer's settings of 3 (9.2 mm), 4 (11.8 mm), 6 (17.9 mm), 8 (24.8 mm), and 10 (31.5 mm).
Experimental design
The experiment was initially designed with three replicates, comparing four feeder adjustment gap sizes within three group size treatments, in a 4 x 3 factorial arrangement. In each replicate, four pens of each group size (16, 20, and 24 pigs) were housed within a single room. One pen of each group size was then assigned to one of four feeder gap openings. As gap opening sizes were modified after the first replicate, the entire experiment was conducted using a 5 x 3 fractional factorial arrangement of treatments. Numbers of pens and pigs per treatment are described in Table 1.
Experimental protocol
Three replicates were performed. Piglets were randomly assigned to the group size-density treatments at weaning. Each pen contained an equal number of females and castrated males, and litter mates were allocated across treatments. Eight days postweaning (Day 0), each pen was assigned to a feeder-adjustment treatment.
Pigs were weighed individually on the day of weaning (Day -8) and on Days 0, 21, and 42. The entire pen was weighed weekly as a group, and feeders were also weighed at this time to allow calculation of feed disappearance. Photographs of feeders were taken every Tuesday at 10:00 am as an illustration of the trough area clear of feed. The area clear of feed was measured using a measuring tape; this area was converted to a percent based on the total feeding-surface area of the trough. If the area clear of feed was circular or triangular, appropriate equations were used to estimate the clear area. Feed depth at three equally spaced locations within the feeder trough was determined when area measurements were made.
During Days 3 to 6 and 39 to 42, the feeder area of each pen was videotaped for one 24-hour period, using a time-lapse recorder, to determine the time spent eating. Four pigs in each pen were used as focal animals to estimate the time spent eating. No attempt was made to estimate other behaviors, such as dominant or subordinate behavior at the feeder. Four pens were recorded onto a single tape by means of a 'quad' (screen splitting device).
On Day 42, each pig was individually observed and scored for evidence of tail biting, side nudging, ear chewing, and general signs of aggression. All procedures employed in this experiment were approved by the Protocol Review Committee of the Committee on Animal Care and Supply at the University of Saskatchewan.
Calculations
Individual pig weights on Days -8, 21, and 42 were used to determine the coefficient of variation (CV) within each pen. Average pig weight calculated from weekly pen weights was used to calculate ADG. Average daily feed intake (ADFI), estimated by feed disappearance, was calculated from weekly feeder weights. Previous experience at the same facility showed that feed wastage with these feeders was minimal.
Instantaneous scan samples of the number of pigs eating at the feeder, sampled at 2-minute intervals, were used to determine time spent eating for the entire day, by converting the mean percentage of pigs accessing the feeder per 2-minute interval to the number of minutes per day or hour each pig spent eating. For example, if an average of 8% of pigs accessed the feeder on scan samples, then the feeder was used for 115 minutes per day (0.08 x 1440 minutes per day). A pig was considered to be eating if its head was over the trough, unless it was sleeping with its head in the feeder.
The body was divided into five regions for scoring of lesions: abdomen, legs, ears, back, and tail. Injuries were graded using a scale of 0 to 2: 0, no apparent injury; 1, evidence of a lesion, but no broken skin; 2, an open wound. The same scale was used to score evidence of joint swelling and lameness: 0, no joint swelling or lameness; 1, some joint swelling; 2, joint swelling with lameness.
Statistical analysis
Pen was considered the experimental unit for all criteria except the within-pen CV of body weight, which was calculated from individual pig weights. The experiment was analyzed as a randomized complete block design, with a fractional factorial arrangement of treatments (because of different feeder adjustments used in the first replicate compared to the second and third replicates). Overall ADG, ADFI, and feed efficiency (gain:feed) were also analyzed, excepting Week 4 of the first replicate when the feed was mistakenly pelleted.
Data were analyzed by analysis of variance using the GLM procedure of SAS (SAS, Version 8; SAS Institute, Cary, North Carolina). The model contained the effects of replicate, group size-density, feeder adjustment, interaction of feeder adjustment and group size-density, and initial weight (Day 0), which was used as a covariate. Except for the two variables for which the model also included the effect of age (CV of body weight and time spent eating), data were analyzed within discreet time periods. Variables included body weight, ADG, ADFI, and feed efficiency, weekly and over the entire experimental period. Statistical analyses of feeder-trough coverage and lesion-score data were performed on pen means. Orthogonal polynomials were used to determine linear or quadratic trends of feeder adjustment. An effect was considered significant if P < .05 and was considered a trend if P > .05 but < .10.
Results
Feeder gap opening
Larger feeder gap opening was not associated with increased ADG during the initial half of the experiment (Days 0 to 21; P > .05; data not shown). However, an effect of diminishing feeder gap opening on ADG was observed during the last week of the experiment (Days 36 to 42; P = .01), and over the entire experimental period (Days 0 to 42; P = .02). Average daily gain over the entire experimental period was 480 grams per day when the feeder gap opening was 9.2 mm and 532 grams per day when the feeder gap opening was 31.5 mm. A larger feeder gap opening was associated with greater body weight at Day 42 (Table 1). The data were less well described by a quadratic curve (P = .08). An inflection point of 25.1 mm was calculated.
Feeder gap opening impacted feed intake only during the fourth week (Days 22 to 28; P < .05) and during the second half of the experiment (Days 22 to 42; P < .02). From Day 22 to 28, daily feed intake was 0.93 kg per pig when the feeder gap opening was 9.2 mm and 1.07 kg per pig when the feeder gap opening was 31.5 mm. During the fourth week of the first replicate of the study, feed was mistakenly pelleted. The overall effect of feeder gap on feed intake was significant (P = .047) if the data from Week 4 in the first replicate are included, but not when these data are excluded (P = .06).
Throughout the entire experiment, feed blockage was a problem when the feeder gap adjustment was set for an opening of 9.2 mm or 11.8 mm. Feeders with these gap openings required blockages to be corrected two to 10 times per week, while feeders with a larger gap size remained trouble free, allowing for a constant supply of feed. Feed intake increased numerically but not significantly up to a gap size of approximately 18 mm, but not with larger gap sizes.
Increases in feed intake were generally accompanied by an improvement in gain, and feed efficiency was not affected by the feeder gap opening (P > .05; data not shown).
The CVs of body weight at weaning (Day - 8) and on Days 21 and 42 are presented in Table 2. There was an age effect on average CV, which was > 20% at weaning, but had decreased to 12.7% by Day 42 (P < .001). Increased variability of body weight at Day 42 was associated with a smaller feeder gap opening (P = .04).
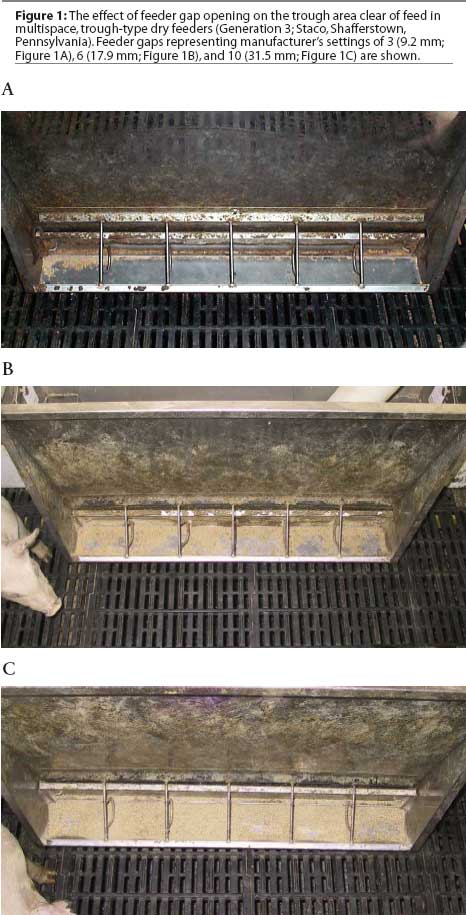
A smaller feeder gap opening was associated with a smaller area of the feeder trough covered with feed (P < .001). Average feed depth increased (P < .001) as feeder gap opening increased (Table 3). This effect is illustrated in Figure 1.
The amount of time the young pigs spent eating (Days 3 to 6) was longer when the feeder gap was smaller and feed was difficult to access (P = .013; Table 4). The effect of the smallest feeder gap was especially marked relative to the next increment (142 minutes per pig per day for the 9.2 mm gap opening; 118 minutes per pig per day for the 11.8 mm opening). Feeder gap opening had no effect on the time spent eating when the pigs were older (Days 39 to 42; P = .29).
Eating activity followed a marked circadian rhythm, with one peak at approximately 8:00 am, shortly after the lights came on, and another at 2:00 pm, before the lights went off. The feeder gap opening did not affect this pattern of eating.
Feeder gap adjustment was not associated with any change in the severity or numbers of skin lesions or with joint swelling scores (P > .05; data not shown).
Group size-density
During the last 2 weeks of the experiment, ADG tended to be lower in pens with larger group sizes, and the cumulative effect was such that ADG from Day 0 to Day 42 was lower in pens which contained the larger groups. In pens with groups of 24 pigs, ADG was 495 grams per day; in pens with groups of 20 pigs, ADG was 518 grams per day; and in pens with groups of 16 pigs, ADG was 531 grams per day (P < .01). Consequently, Day 42 body weight was greater in pens with a smaller group size (P < .01; Table 1). Increased pig density was associated with decreased feed intake (ie, feed disappearance, ADFI) during the final half of the experiment (Days 22 to 42). During this period, ADFI was 975 grams with 24 pigs per group; 1029 grams with 20 pigs per group, and 1050 grams with 16 pigs per group (P = .01). This effect was also apparent over the entire experimental period (Days 0 to 42): overall ADFI was 719 grams with 24 pigs per group; 771 grams with 20 pigs per group; and 774 grams with 16 pigs per group (P = .01). Increases in feed intake were generally accompanied by an improvement in gain, and feed efficiency was not affected by the number of pigs in a pen (P > .05; data not shown).
The CV of body weight was greater in pens with larger group sizes at Day 21, but not at Day 42 (Table 2).
The number of pigs per pen did not affect either the average proportion of the feeder trough clear of feed or feed depth (Table 3). Increasing the number of pigs per pen had no effect on the time spent eating in young or older pigs (Table 4). The pattern of eating was not affected by the group size (data not shown).
The mean skin lesion score of 0.06 with 24 pigs per pen decreased to 0.05 and 0.03 with 20 and 16 pigs per pen, respectively (P =.02). However, this effect could not be attributed to any specific body region (P > .05 for individual body regions).
Feeder gap size by group size-density interactions
The effect of group size on final body weight (Day 42) was accentuated at smaller feeder gap openings (interaction of feeder gap opening and group size-density, Figure 2). The effect of group size on the total time spent eating was most evident at the smallest feeder gap opening (Figure 3).
Discussion
The effects of feeder gap adjustment and group size-density treatments were not always apparent on a weekly basis, but had progressive effects, and became significant in the latter half of the experiment. We would expect the negative effects of either to have been exacerbated if the experiment had continued. Floor space allowance in this experiment decreased with increasing group size, while pen size was constant. Thus, group size and floor space allowance were confounded. Group size, independent of floor space allowance, may have affected the results. As group size increases, the free or unused space in a pen increases.9,10 Studies examining the impact that various group sizes have on performance of weanling pigs are limited. Generally, performance effects are seen only when group size varies to a large extent. After reviewing the literature, Kornegay and Notter3 concluded that the effects of increasing group size from five to about 30 pigs per pen had minimal effects on the daily gain of growing and finishing pigs. Increasing the group size from two to 15 pigs per pen had only modest effects on the growth of weanling pigs.3 When pigs were housed in groups of three, five, six, seven, 10, or 15 pigs per pen, at three different space allowances, increasing group size had a negative effect on performance, and the greatest effect of group size occurred between the very small and the intermediate-sized groups.11 Increasing group size from 10 to 15 animals did not affect performance.11 Conversely, in other studies, ADG and ADFI were negatively affected during the nursery phase when space allowance was decreased from 0.25 m2 to 0.16 m2 by increasing the group size from 12 to 18 pigs per pen.5 Similarly, when weanling pigs were housed in groups of four, but with pen sizes adjusted to provide 0.28 m2 to 0.14 m2 of floor space per pig, the lowest ADG and ADFI were observed in groups with the least floor space.6 We propose, therefore, that the detrimental effects of the group size-density treatments in our study are a result of decreasing floor space allowance rather than group size per se.
It has been suggested that space allowance should be based on body surface area, which is proportional to body weight.12 For growing pigs maintained on fully slatted floors, the Canadian Code of Practice8 recommends using the formula Area = k x BW.667, where Area is the recommended floor space allowance in meters, BW is body weight in kg, and the coefficient k is .035. Others9 have used .030 as the constant for k. In a study in which floor space allowances were adjusted as the pigs grew, productivity was affected by crowding with coefficients between .030 and .039.11 In an earlier study, movable partitions were used to adjust floor space allowances in pens containing seven pigs.4 As a result of this work, a minimum floor space allowance on slatted floors of 0.27 m2 per pig was proposed3 for pigs weighing 11.5 to 18.0 kg, and 0.37 m2 per pig for pigs weighing 18 to 45.5 kg (corresponding to the group sizes of 16 and 20 pigs per pen in our experiment). On Day 0 of our experiment, pigs were allowed between 300% (16 pigs per pen) and almost 190% (24 pigs per pen) of the space allowance recommended in the Canadian Code of Practice for the Care and Handling of Pigs.8 However, by Day 42, when body weight had increased to almost 30 kg, the floor space allowance provided only 105% (16 pigs per pen) to 70% (24 pigs per pen) of the Canadian recommendations.8 The most crowded treatment in our experiment (24 pigs per pen, 0.23 m2 per pig) provided less than 100% of the Canadian Council on Animal Care recommendation by Day 28 and less than 100% of the recommendation cited by Wolter et al9 by Day 35. According to these recommendations, the pigs in our experiment were crowded by the second half of the trial, which is indeed when detrimental effects of crowding became apparent.
In agreement with what has been observed by others,3,5,6,13-15 reducing the floor space allowance by increasing animal density was associated with lower ADG and ADFI, but there was no effect on feed efficiency. This suggests that the decrease in gain was primarily caused by the reduction in feed intake. In fact, Kornegay and Notter3 concluded that 75% of the decrease in daily gain could be explained by a reduction in feed intake. Similar to what was observed with ADG, this effect is probably associated with crowding (ie, reduced floor space allowance), not group size per se. When group sizes of 6, 18, and 36 were maintained at a constant floor space allowance, group size had no effect on feed intake, but feed efficiency was reduced in the larger groups.16 These authors observed higher activity levels, and therefore greater energy expenditures, in the larger groups. In our experiment, as the pigs increased in size and weight, their space available for movement and other activities became more restricted. In other studies, concentrating either the energy17 or lysine6 content of the diet did not overcome the decrease in performance associated with crowding. This indicates that the problem is not a restriction in ability to consume feed, but a reduction in appetite, as suggested by others,18 or is perhaps due to increasing aggressive behaviors. We did not measure dominant or subordinate behavior; however, we did observe an increase in overall lesion score when the pigs were more crowded, suggesting increased aggression.
Similar to what was observed with the group size-density treatments, effects associated with the feeder gap opening were not apparent until the latter half of the experiment. There was an interaction of feeder gap opening and group size-density on gain in the final week of the experiment. The poorest performance was observed in the pen with the most pigs (ie, smallest floor space allowance) and the smallest feeder gap opening. This demonstrates that the pigs could tolerate some crowding if other resources were not limiting. Typically, when experiments are designed to examine the impact of crowding or floor space allowance on pig performance, feeders are adjusted so that the availability of feeder space per pig is maintained regardless of group size.5,6,9,16 However, in a trial that did examine the interaction of group size and feeder space, there was no effect of the interaction between the two treatments on performance.19
The size of the feeder gap also contributed to differences in body weight, ADG, and ADFI. A tighter feeder adjustment decreased the ease and speed at which the feed could be accessed. Feed flow in the feeders with the smaller openings was frequently blocked, while those with a larger gap size remained trouble free and allowed for a constant supply of feed. Reducing the size of the feeder gap not only increased labor, but restricted the pigs' access to feed to times when the animal technician was present to assist with feed flow. The lower ADG, ADFI, and average weight observed in these pigs may have occurred because their ability to access feed was less than their ability to consume it. Average daily gain and average weight were not significantly affected during the first few weeks of the trial when nutrient needs were less, as the pigs could access feed as fast as they could consume it, regardless of treatment group. There was a positive linear relationship between the feeder gap opening and final body weight. The shape of the response curve also tended to be quadratic. An inflection point of 25.1 mm was calculated; however, we feel this should be viewed with caution, as the final weight of pigs in pens with gaps of 17.9 to 31.5 mm varied by less than 0.4 kg (1.0%).
The optimum feeder gap size changes with the physical consistency of the feed. Therefore, to provide practical recommendations, feeders were photographed, and the percent of the trough that was clear of feed was determined. On the basis of improvements in ADG and feed efficiency, the optimal gap size in our experiment, when feed was provided as a crumble, occurred at intermediate gap openings of 17.9 mm to 24.8 mm. This corresponded to approximately 56% to 26% of the feeder trough clear of feed. We propose that this optimal trough covering is independent of the physical consistency of the feed.
Younger pigs spent more time eating. The amount of time a pig spends eating begins to decline at about 21 days postweaning.14 Older pigs spend less of their time eating because they eat faster and consume larger amounts in a single meal.2 The interaction of group size-density and feeder adjustment on eating time illustrates that pigs in the smaller groups compensated for restriction of feed availability by spending more time at the feeder. The effect of density-group size on eating time was no longer apparent at larger feeder gap openings.
The performance of older pigs was affected by feeder adjustment because they could not access feed as fast as they could eat, or because they were not prepared to increase the proportion of their time spent eating in order to obtain feed. Interestingly, in our experiment, the pigs did not change their diurnal pattern of eating with different group sizes or feeder gap openings. Conversely, when more pigs were fed from a single feeding space, the diurnal pattern of feeding was altered.18 Using electronic feed intake recording equipment, Hyun and Ellis (2002)20 showed that finishing pigs maintained intake and growth rate by changing feeding behavior when group size increased from two to 12 pigs per pen; however, this was not the case in growing pigs.21 Crowding of older pigs resulted in fewer but longer feeder visits and higher feed intake per visit.22
All pigs in our experiment had access to the same number of feeding spaces regardless of pen density; thus, it can be concluded that feeders that allow for easier feed access also allow for more pigs to eat from each feeding space. Therefore, by optimizing the feeder gap, the number of pigs able to utilize a given feeding space increases. Gonyou18 found that pigs with easier access to feed spent less time at the feeder, allowing for more pigs to be fed from a single feeding space, and concluded that feeder capacity was achieved when it was being used 90% of the time. In our experiment, this implies that the maximum capacity is 11 pigs for a nursery feeder adjusted to a 25-mm or 32-mm gap opening. This, of course, would change for feed with different physical characteristics and for different feeder designs.
Lower joint swelling scores and lesions associated with fighting or biting were observed in pens with smaller group sizes. This is not surprising, as more floor space results in less direct interaction among pigs; however, changes in these indicators of aggressive behavior were not associated with changes in animal performance. Similarly, the overall lesion score tended to be higher when the feeder gap opening was the smallest. Spoolder et al23 showed that the number of aggressive interactions at the feed trough was not affected by group size, but did decrease with the number of feeder spaces available.
Producers strive to market uniform groups of pigs. As observed by others at our research facility1 and elsewhere,4 the variability in pig weight was not affected by group size-density. The present experiment was concluded when the pigs were approximately 10 weeks of age. However, in an earlier study,1 in which pigs were housed either 16 per pen (0.35 m2 per pig) or 21 per pen (0.26 m2 per pig), lack of an effect of crowding on variability in body weight was maintained at Day 140.
Providing more floor space per pig in this experiment was associated with increased body weight at approximately 10 weeks of age. The increased body weight would not be sufficient to compensate for the smaller number of pigs housed, thus the kg of pork produced per floor space in the nursery would be less at the larger floor space allowances. However, less crowding would result in fewer days to market, which might improve the overall cost effectiveness of the swine production unit.
Implications
- Under the conditions of this study, increasing space allowance from 0.23 m2 per pig to 0.35 m2 was associated with increased body weight at approximately 10 weeks of age.
- Optimal growth and feed efficiency were observed when the feeder gap opening allowed 25 to 60% of the feeder trough to be consistently clear of feed.
- The capacity of a nursery feeder space is 11 pigs when the feeder gap opening allows 25 to 60% of the feeder trough to be clear of feed.
References
*1. Cooper DR, Patience JF, Gonyou HW. Effect of gender and crowding on variation in days to market. Annual Research Report. Prairie Swine Centre Inc, Saskatoon, Saskatchewan. 2001.
2. Gonyou HW, Lou Z. Effects of eating space and availability of water in feeders on productivity and eating behavior of grower/finisher pigs. J Anim Sci. 2000;78:865-870.
3. Kornegay ET, Notter R. Effects of floor space and number of pigs per pen on performance. Pig News Info. 1984;5:23-31.
4. Gehlbach GD, Becker DE, Cox JL, Harmon BG, Jensen AH. Effects of floor space allowance and number per group on performance of growing-finishing swine. J Anim Sci. 1966;25:386-391.
5. Brumm MC, Ellis M, Johnston LJ, Rozeboom DW, Zimmerman DR, NCR-89 Committee on Swine Management. Interaction of swine nursery and grow-finish space allocations on performance. J Anim Sci. 2001;79:1967-1972.
6. Kornegay ET, Lindemann MD, Ravindran V. Effects of dietary lysine levels on performance and immune response of weanling pigs housed at two floor space allowances. J Anim Sci. 1993;71:552-556.
7. Bryant MJ, Ewbank R. Some effects of stocking rate and group size upon agonistic behaviour in groups of growing pigs. Br Vet J. 1972; 128:64-70.
8. Connor ML. Recommended code of practice for the care and handling of farm animals. Pigs. Agriculture and Agri-Food Canada; 1993. Publication #1898/E.
9. Wolter BF, Ellis M, Curtis SE, Parr EN, Webel DM. Group size and floor-space allowance can affect weanling-pig performance. J Anim Sci. 2000;78:2062-2067.
10. McGlone JJ, Newby BE. Space requirements for finishing pigs in confinement: behavior and performance while group size and space vary. Appl Anim Behav Sci. 1994;39:331-338.
11. Gonyou HW, Stricklin WR. Effects of floor area allowance and group size on the productivity of growing/finishing pigs. J Anim Sci. 1998;76:1326-1330.
12. Hurnik JF, Lewis NJ. Use of body surface area to set minimum space allowances for confined pigs and cattle. Can J Anim. Sci. 1991;71:577-580.
13. Jensen AH, Baker DH, Harmon GB, Woods DM. Response of growing-finishing male and female swine to floor space allowance on partially and totally slotted floors. J Anim Sci. 1973; 37:629-631.
14. Spicer HM, Aherne FX. The effects of group size/stocking density on weanling pig performance and behavior. Appl Anim Behav Sci. 1987;19:89-98.
15. Lindvall RN. Effect of flooring material and number of pigs per pen on nursery pig performance. J Anim Sci. 1981;53:863-868.
16. Petherick JC, Beattie AW, Bodero DAV. The effect of group size on the performance of growing pigs. Anim Prod. 1989;49:497-502.
*17. Levesque CL, Patience JF, Beltranena E, Zijlstra RT. Response to dietary energy concentration and stocking density in weaned pigs [abstract]. Adv Pork Prod. 2002;13:21.
*18. Gonyou H. Feeder and pen design to increase efficiency. Adv Pork Prod. 1999;10:103-113.
19. Lindemann MD, Kornegay ET, Meldrum JB, Schurig G, Gwazdauskas FC. The effect of feeder space allowance on weaned pig performance. J Anim Sci. 1987;64:8-14.
20. Hyun Y, Ellis, M. Effect of group size and feeder type on growth performance and feeding patterns in finishing pigs. J Anim Sci. 2002;80:568-574.
21. Hyun Y, Ellis M. Effect of group size and feeder type on growth performance and feeding patterns in growing pigs. J Anim Sci. 2001;79:803-810.
22. Hyun Y, Ellis M, Johnson RW. Effects of feeder type, space allowance, and mixing on the growth performance and feed intake pattern of growing pigs. J Anim Sci. 1998;76:2771-2778.
23. Spoolder HAM, Edwards SA, Corning S. Effects of group size and feeder space allowance on welfare in finishing pigs. Anim Sci. 1999;69:481-489.
* Non-refereed references.